
 Where are the Black Swans?
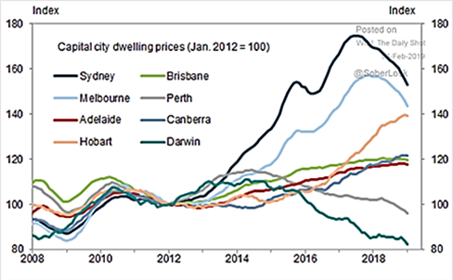
- By definition, a “black swan” is a very-low-probability, high-negative-magnitude-market-moving event that runs counter to conventional wisdom. The global financial crisis in 2009 is the most recent example as beliefs that US housing prices could never fall across the country simultaneously led to massive systemic leverage and thus wide-spread defaults and losses globally. While today the wobbly economies and often-hysterical politics of UK/Europe, Japan, China and the US have been well-documented here and elsewhere, we propose either Canada or Australia (or both) as the source for the next black swan. Both are large countries as measured by GDP (#10 and #14, respectively per the IMF alongside South Korea, Russia and Spain), certainly large enough to have an impact. They are geographically relevant, closely tied economically to the two largest powers, US and China respectively, to be affected by events in those larger countries. With both the US and China projecting lower GDP growth in 2019 and in the middle of trade war, these importers of commodities and other products could undercut our two contenders. Finally, taking a page from the global financial crisis above, both countries have massive real estate bubbles that have showed signs of cracking (or have already cracked). The top
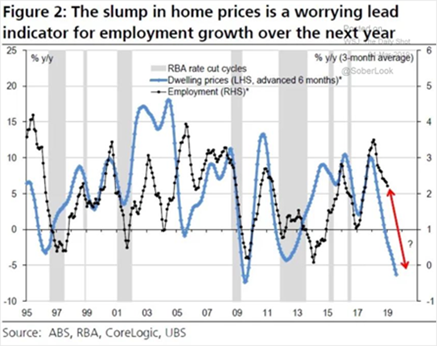 graph to the right shows the 25% fall or so in Sydney home prices (top line) with Melbourne right behind. Major cities in Canada show a similar pattern (e.g., Vancouver home sales fell 47% year-on-year December along with prices and similar for Toronto). Historically, Australian home price movements have been associated with changes in employment (see lower graph partially based on information from Australia’s central bank). The warning is simple: slowing export demand, lower home prices and lower employment sums up to economic trouble. Combine that with tough global conditions and something, somewhere can start handing real losses to markets. The most recent GDP figures had Canada missing expectations to grow at the lowest level in three years (+1.0% Q4 2018 year-on-year) and Australia did as well, growing at slowest rate since 2016. Given these two countries’ exposure in metals, grains, energy and livestock, this is good reason also to monitor commodities!
Global Oil Production
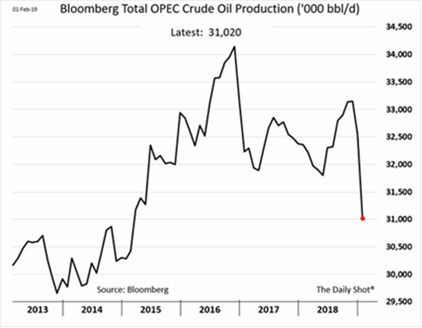
- drifted lower as OPEC+ declines were only partially met with US increases. OPEC output fell in February to its lowest level since February 2015. At 30.68 million barrels per day (mbpd), the figure was 300,000 bpd below January’s output. OPEC has cut more than they said they would in their recent agreement (graph to the right is through January). Three OPEC sources indicated to news media that any change in production policy will not happen at the next meeting in April but perhaps in June. Interestingly, the OPEC cuts have impacted the available mix of oil quality needed to run refineries most efficiently – lower quality crude is needed!
 The Saudi oil minister said that they would reduce their output in March to 9.8 mbpd, which is 500,000 bpd below their agreed upon OPEC quota (Reuters), with exports correspondingly falling to 6.9 mbpd. Russian oil output declined to 11.3 mbpd, still higher than the global oil accord’s target. However, oil minister Novak promised to start cutting production more aggressively in late March or early April and reach the promised objective by October. Both Iran and Venezuela have seen their exports fall in the past two months. Venezuela shipped 40% less crude oil in February, the first month of sanctions. Crude shipments fell to 675,000 bpd, about half the level prior to sanctions. Iranian exports in January were down 49% from 2018 level at 710,000 bpd, but February’s exports were seen rising to 1.4 mbpd as waivers from the US were in place (Reuters). Iran’s budget deficit at the end of 2018 came in twice as high as the forecasted at -2.5% of GDP, despite oil revenues 17% higher than planned. Slower economic growth (GDP declined by -1.5% in 2018) overall led to the miss, with a further decline of -3.6% expected for 2019 by the IMF. Mexico’s oil production in January fell to the lowest level since 1990 at 1.6 mbpd, trailing the 2018 average of 1.8 mbpd. Finally, Libya lifted the force majeure restrictions effecting their massive El Sharara oil field. Initial restart output was 135,000 bpd with a goal of over 300,000 bpd, offsetting much of the OPEC cuts from 2018.
 US Crude Oil Production
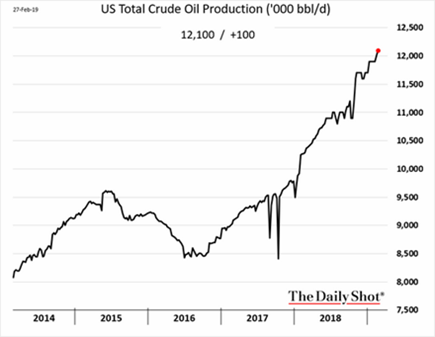
- again ticked higher to 12.1 mbpd of crude oil but concerns continued over the decline of drilling rigs in operation: from 847 on February 1st to 843 on March 1st. US crude oil output was expected to rise 1.45 mbpd this year and 790,000 bpd more next year, bringing total output to 13.2 mbpd, the Energy Information Administration said in its monthly forecast. If realized, both of these forecast levels would surpass the record high of 11.0 mbpd set in 2018, keeping the United States as the world’s largest producer of crude oil! Output from seven major shale formations is expected to rise 84,000 bpd in March to a record of 8.4 mbpd. The largest change is in the Permian Basin of Texas and New Mexico, where output is expected to climb by 43,000 bpd to a record 4.0 mbpd. Both Exxon and Chevron detailed their intentions to raise oil and gas production in the Permian over the next 5 years. They each forecasted close to 1.0 mbpd oil equivalent a day just from the Permian by 2024. Exxon said its Permian output can still generate a 10% return if oil prices were at $35 a barrel and currently are over 30% at today’s prices. US oil exports continued their trend higher, hitting over 3.5 mbpd at one point. This year, the US may export 20-25% of domestic crude production, 15% of natural gas and 40% of NGLs from gas processing, per RBN Energy. Back in 2014, before the ban on most crude exports was lifted, a paltry 4% of U.S. crude oil production was exported, and 6% of natural gas. Truly a turnaround from the “peak oil” fears a few decades ago!
US-China Trade Negotiations
- continued during February with chatter of progress but still no deal yet. Trump deferred imposing additional tariffs on the original March 1st deadline, and meanwhile a Trump-Xi summit at the end of March has been floated in the media, implying a treaty in the near future. We shall see.
Other Commodities Headlines
- included that despite more US coal-fired power plants were shut in Trump’s first two years than were retired in the whole of Obama’s first term, the first new coal-based power plant was just finished in Fairbanks, Alaska. In an isolated location relatively close to an existing coal mine, it replaces an aging coal plant. At least the emissions are expected to be lower and no other coal power plants are under construction in the US. In grain news, look for larger and larger production numbers. Argentina’s soy crop is expected to reach 52 million tonnes during the 2018/19 season, up from 50 million tonnes previously forecast with their corn crop seen at 46.5 million tonnes versus 44 million. Ukraine’s grain exports have risen to 30.17 million tonnes so far in the 2018/19 season, up from 24.88 million tonnes year-on-year. Full season exports could rise to at least 47 million tonnes from 39.4 million the season before. The country harvested a record 70 million tonnes of grain last year, up from 61.3 million in 2017. On the other hand, Australia’s wheat production fell to an 11-year low during the 2018/19 season, the country’s chief commodity forecaster said, after a drought wilted crops in the world’s No. 4 exporter. Output totaled 17.3 million tonnes, down from 21.24 million tonnes a year earlier.
David Burkart, CFA
Coloma Capital Futures®, LLC
www.colomacapllc.com
Special contributor to aiSource