
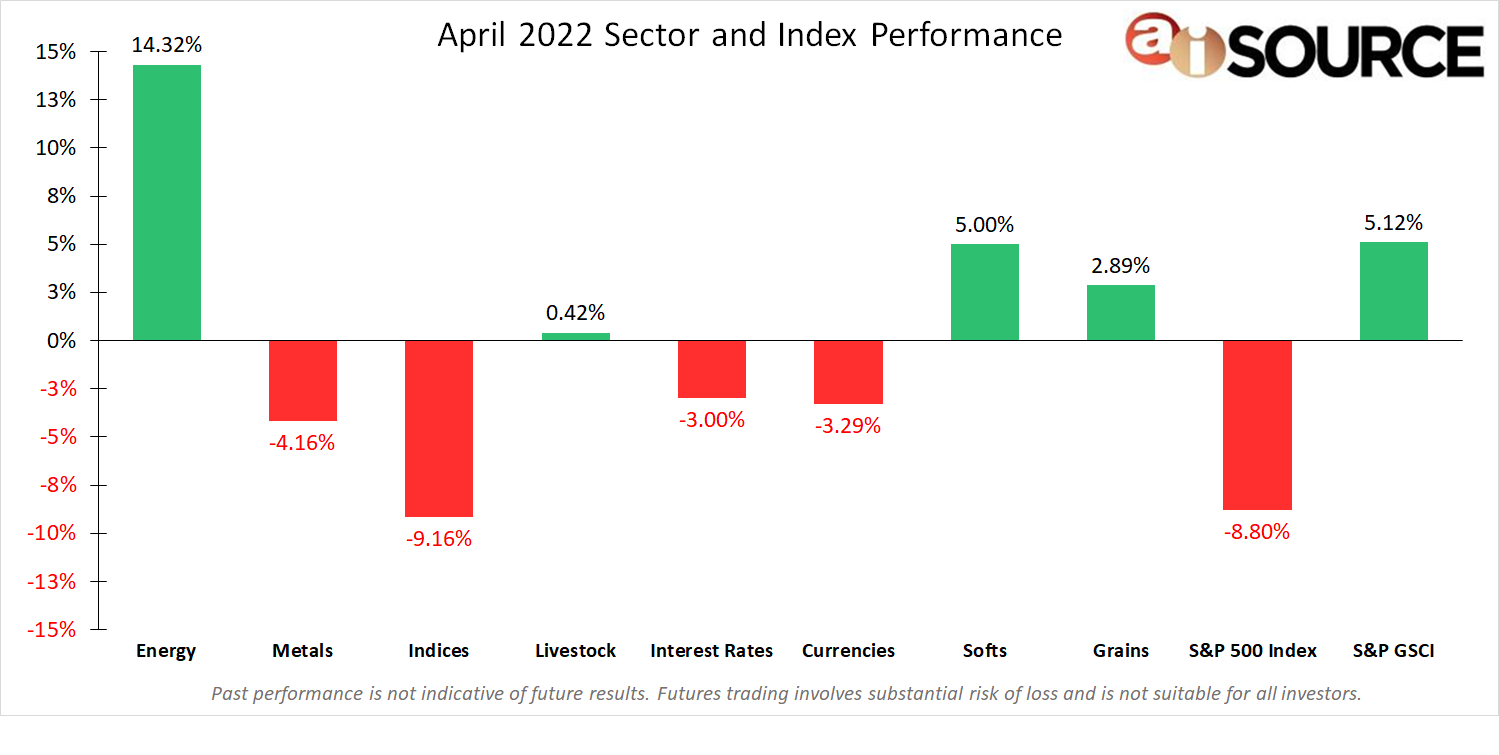
During the month of April, the top 3 performing sectors were: energies (+14.32%), softs (+5.00%), and grains (+2.89%). The bottom 3 sectors were: indices (-9.16%), metals (-4.16%) and currencies (-3.29%). The S&P 500 fell nearly -9.0% in the month of April, with the Nasdaq even lower at -13.56% with one of the worst starts to a year in stock market history. Month end earning for companies fell short of expectations, which put downward pressure on the major indices. Most commodities continued their gains through the end of April, as the US dollar continued its impressive move higher against all other major currencies. It seems that only one thing is guaranteed in the immediate future and that’s volatility.
For month-to-date and year-to-date CTA rankings, please remember to visit our CTA Database. If you do not have a login and wish to register for free, please click here.
Sector & Index Performance Consists of the following:
Grains: Corn, Soybean Meal, Oats, Soybeans, Soybean Oil, Wheat, Rough Rice. Livestock: Live Cattle, Feeder Cattle, Lean Hogs. Softs: Cocoa, Orange Juice, Sugar No. 11, Random Length Lumber, Coffee, Cotton No. 2. Currencies: Euro Currency, Japanese Yen, British Pound, Canadian Dollar, Swiss Franc, US Dollar, Brazilian Real, Mexican Peso, Australian dollar. Indices: S&P 500, Mini Dow, Mini Nasdaq. Interest Rates: 30-year t-bond, 10-year t-note, 5-year t-note, Eurodollars. Metals: Gold, Silver, Copper, Platinum, Palladium. Energy: Crude Oil, Reformulated Gas, Natural Gas, Heating Oil, Denatured Fuel Ethanol. All data collected from investing.com. S&P 500 Index – data collected from investing.com. S&P GSCI Index – data collected from us.spindices.com/indices/commodities/sp-gsci.