
Tangled Trade Tensions
- makes headlines but political noise gets in the way of understanding its impact. Per the NY Fed’s blog (libertystreeteconomics.com) on November 25th, import prices on Chinese goods are slightly lower (-2% on average) since the first additional tariffs were imposed in July 2018. As a reminder, just after June 2019, according to the US Trade Representative estimate, $250 billion in Chinese goods were hit with an additional 25% tariff with a 15% tariff on an additional estimated $120 billion applied in September. The Chinese made similar increases over the same time frame on their imports from the US, though on smaller dollar amounts. This all sounds very damaging to the US economy but that conclusion is simply wrong. First, the US tariffs on China have had minimal impact to the US consumer, as measured by inflation rate which has declined over the four years, from +2.1% in 2016 to +1.8% in 2019 (rolling 12 months). As a point of reference, annual inflation has averaged 2.2% since 2000, demonstrating that inflation under Trump has been on par or lower than other recent presidents. Annual Real GDP also has been better than recent history, with the average since 2000 at +2.1% and since 2016 +2.5%. In addition, US unemployment hit new record lows. A May 2019 NY Fed article estimated that the tariffs cost the average US household $419 per year. At $63,179 of real annual household income in 2018, that is 0.66% of household income or about 1/3 the rate of inflation. Given the lower rate of inflation in recent years to those previous years without tariffs, other effects must be primarily driving higher consumer costs.
What Is the Missing Trade War Impact?
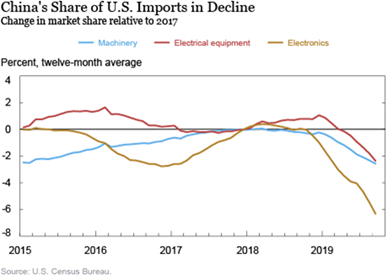
- The NY Fed noted that many affected goods are no longer coming from China (see graph right). They state that China’s lost market share has gone largely to Europe and Japan for machinery and to Malaysia, South Korea, Taiwan, and Vietnam for electronics and electrical equipment. More broadly, total US imports from China have declined from 2018 (from about $45 billion monthly to $32 billion monthly – a rate last seen in 2012). Simply put, mass substitution has occurred (note also that not all Chinese exports to the US are affected by additional tariffs). US exports to China have fallen as well, from $10 billion per month in 2018 to about $7 billion – about the same percentage but a much lower base.
Who Has Been More Hurt Economically?
- China, on an absolute and relative basis. China has lost roughly $156 billion in annualized exports on a $13 trillion economy (or just over 1% of GDP) and the US has lost $36 billion in annualized exports on a $20 trillion economy (0.2% of GDP), assuming nothing else changed. Is this a good thing? Is it as bad as the hype makes it out to be? Not that either. Given what is at stake is bigger – real geopolitics, global military presence, intellectual property, technology innovation – then the tariff conflict could find justification as a means in the larger picture. On the other side of the aisle, Democrats may not appear to be so obviously confrontational but some have anti-China agendas. For example, Elizabeth Warren’s self-described platform of “economic patriotism” aspired to expand trade consideration beyond labor and environment to include human rights, carbon/greenhouse gas emissions and other issues that would force China to radically change their economy and totalitarian society if implemented. In short, this US-China conflict is reality and will not be resolved by a “deal”.
Other Tariff News
- included more negotiation on a “Phase One” agreement primarily focused on Chinese agricultural tariffs against the US. The US Congress still floated the idea of debating the updated North America trade deal (USMCA) despite the political turmoil. Trump expanded the pressure on the Chinese by threatening to re-impose tariffs on Argentine and Brazilian metals imports as those countries have stepped up their food exports to China, replacing the US. With regards to Europe, the Trump administration threatened import taxes on $2.4bn worth of French goods, including cheese, champagne, make-up and handbags in response to a new French digital services tax that would affect technology companies including Google, Amazon and Facebook.
OPEC + Oil Production
- was under scrutiny at their December 5th meeting, with a formal cut of 500,000 barrels per day (bpd) and the potential for more from Saudi Arabia if there is compliance. However, many speculate that the reality would be a 100,000 bpd production restriction, given the constant misses on existing quotas from Iraq, Nigeria and Russia, more is unlikely in my opinion. Saudi Arabia is motivated to cut further to support oil prices to justify its IPO price for Aramco, which was valued at the high end of the range at $1.7 trillion – just shy of the $2.0 trillion target but well above the low end of $1.2 trillion. Pride and justification would compel them to support oil in the high $50s, even at the risk of increasing US
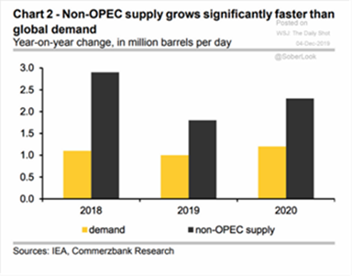 production. However, as they rebuild their oil inventories after the (believed) Iranian attack on September 14th, that overhang will limit price increases. The International Energy Agency saw non-OPEC countries adding another 2.3 mbpd to their supply in 2020, while global oil demand growth is expected at 1.2 mbpd (see right). Even if the US slows down its growth, strong increases were projected out of Brazil and Canada. Norway too, despite its green credentials, should expand its crude oil production by 300,000 bpd in 2020.
In Other Energy News
- Iran increased its gasoline prices by 50% to 35 cents per liter setting off riots which were put down with force, killing hundreds. Iran’s economy has declined by over 10% this year due to US sanctions. Iraq protests also continued with its government using live ammunition to break up gatherings. Russia started shipping more natural gas to China with the completion of a 3,000 kilometer pipeline that crosses Siberia, giving both countries more energy options. Oil-rich Angola issued a $3 billion 10- and 30-year bond deal taking its debt-to-GDP level to 100%, paying a hefty yield. Finally, China has planned 148 gigawatts of new coal-fired power plants, a number equal to all of the EU coal-based electricity production, with 121 gigawatts under construction. While existing coal plants run at only 50% utilization, local governments and companies get support from the central government as they create jobs and meet centralized investment goals. No “clean” coal over there either.
US Crude Oil=

- weekly numbers implied an increase in production to 12.9 mbpd of crude oil despite a continuing decline in operating drilling rigs =from 691 on November 1st to 668 on November 29th. US oil output was projected to rise an additional million bpd to 13.3 mbpd in
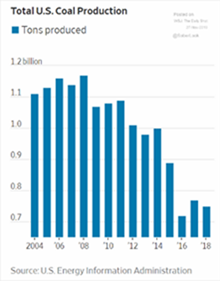 2020. Output from the seven major shale formations was expected to rise 49,000 barrels per day in December to a record 9.1 mbpd, the US Energy Information Administration said in its monthly forecast. The largest formation, the Permian Basin of Texas and New Mexico, is expected to add 57,000 bpd to 4.7 mbpd, the eleventh consecutive increase. Fracking’s impact on US production can be seen in the graphs to the right while the US coal output collapse is seen in the graph to the left. With regards to exports, the United States exported 89,000 bpd more petroleum (crude oil and petroleum products) than it imported in September, the first month this happened since monthly records began in 1973.
China’s Oil Imports
- hit a record in October as the country shipped in 10.7 mbpd, up 11.5% from the same month in 2018 and eclipsing the previous high of 10.6 mbpd from April. Officially, China rotated from Iran to Saudi Arabia, which saw an increase of 76% of its exports to China, year-on-year. The graph on the next page to right summarizes the rapid growth of oil consumption
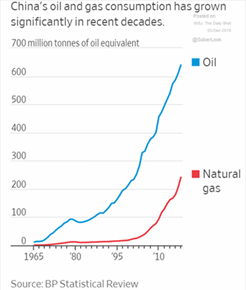 (recall there is about 7.4 barrels per metric ton, so the 650 million tonnes a few years ago is equal to about 13 mbpd). China’s gasoline exports in October more than doubled from a year ago to a record as refiners’ increasing processing runs created a fuel surplus in the domestic market, spurring overseas sales. Gasoline shipments were over 425,000 bpd last month, as compared to 412,000 bpd in September and 160,000 bpd in October 2018. Refinery margins in Asia have been knocked to the lowest since the financial crisis in 2008, damaging the trade balances of South Korea and Singapore in the process.
China’s Pork Supplies
- are still in critical condition though official statistics indicated a slower rate of loss. China approved six new Argentine slaughterhouses and processing plants to handle the increasing beef import and thirteen Brazilian meatpacking plants for the same… no wonder Trump expanded his China tariff view to South America. China’s pork prices fell sharply in October for the first time in 10 months, as reports of fresh disease outbreaks in the northeast led to more hogs being sent for slaughter just as consumers cut back on pricey meat. Officially China’s inventory of breeding sows rose +0.6% in October for the first monthly increase since April 2018 and the decline in the pig herd is also slowing, said Yang Zhenhai, a director at the Ministry of Agriculture and Rural Affairs. Pork imports from the rest of the world for 2019 through October were up +50% as well.
Global Grains
- appeared reasonably well-supplied as the US harvest is effectively over. Soybean plantings for the new Brazilian crop (2019-20) have reached 77.3% of the expected area to be planted, a slower pace than seen last year (89.6% of area) and also lagging the five-year average (80.5% of area). Brazilian farmers are expected to plant more than 18 million hectares of corn in the 2019/20 season, +3.5% from the previous cycle and the largest area on record. Despite weather risks stemming from late planting of Brazil’s second corn crop, total output may reach 101 million tonnes. Dryness still plagues Australia where FCStone pegged wheat production at 15.5 million tonnes, 19.1% lower than the official estimate of 19.2 million tonnes. The recent change of power in Argentina back to the left-wing populists was expected to affect the country’s future grain production given past policies of debt non-payment and foreign exchange controls. Finally, the biggest US milk company, Dean Foods, filed for bankruptcy as Americans drank less milk and retailers such as Walmart opened their own dairy plants.
David Burkart, CFA
Coloma Capital Futures®, LLC
www.colomacapllc.com
Special contributor to aiSource