
Ukraine: Winter & Sanctions Impact
The Ukraine-Russia Conflict began to settle into winter, with Russia targeting electrical infrastructure and Ukraine making headlines by inflicting damage on an important bridge linking Crimea to Russian conquered territories in south-east Ukraine. Russia’s additional mobilization of 300,000 or so recruits will spend the winter training for spring operations. Putin’s generals need to go big or go home – so going big in 2023 is the only real option. Back to the war of wills and logistical attrition for the next three to six months.
War by Other Means extended to the commodities front as Ukraine’s battlefield success caused Russia to back out temporarily of the UN-brokered grain export deal before reversing course a few days later. With the agreement expiring on November 19th, a spike in exports has been followed by marked slowing. Ukraine has shipped approximately 9 million tonnes of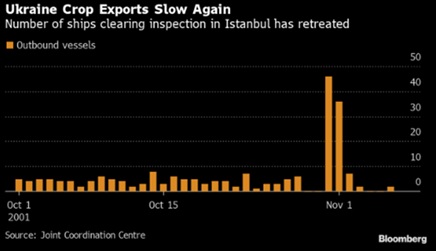 grain since the UN export deal at the beginning of August. Russia’s crude oil output in October was 9.9 million barrels per day (mbpd), down marginally from September’s level of 10 mbpd. In January, before the Ukraine invasion, Russia’s output was 11.3 mbpd. Italy’s ENI CEO saw the EU bloc losing 2 mbpd of Russian crude and refined products due to their upcoming ban of Russian energy products and oil price caps. Aluminum and shares of metal producers soared in mid-October following news that the Biden administration was considering a complete ban on Russian aluminum in response to Russia’s military escalation in Ukraine. Metal products from Russia have so far been shielded from sanctions due to their importance in everything from automobiles and skyscrapers to iPhones. Significant volumes of unwanted Russian-origin copper have been deposited in London Metal Exchange approved warehouses in Germany, the Netherlands and Taiwan since the middle of September because some consumers have been rejecting Russian copper (Reuters). The LME had to act as the market of last resort for this unwanted product.
Macro: China
Reopening Plan Underway? The first week of November was awash with rumors around China moving forward with a possible path away from their COVID Zero policy. However, China posted a surge to a 6-month high in cases on November 4th despite their harsh restrictions and recent set of lockdowns. Beijing quashed these market rumors and reiterated that a rapid reopening would be unlikely. Looking ahead, if there is a change in policy that materially opens economic activity, we would expect a strong increase in demand for commodities, economic activity (GDP), imports and exports, a staving off of the impending nationwide credit crisis and a cementing of Xi’s totalitarian command of the country. While tempting, such a change in policy may not be until March with the opening of China’s parliament.
China’s GDP Grew Below Target in the third quarter, expanding +3.9% year on year, better than the forecast of +3.3% from analysts polled by Bloomberg but still short of China’s full-year target of +5.5%. In September, retail sales rose by just +2.5%, missing a Reuters forecast of +3.3%. Industrial production rose 6.3%, better than analysts’ expectations of 4.5%. However, that was before the shutdown of the massive Foxconn factory in October. Property continues to underperform as property sales, measured by floor area, were down 22% and new constructions starts have slumped 38%. The graph right shows the continued slump in housing prices for the thirteenth month in a row. Meanwhile, China’s budget deficit neared a record $1 trillion – almost three times last year’s number as slumping land sales and tax cut stimulus hurt government revenue. Exports grew +5.7% in September from a year earlier, beating expectations, but imports rose only +0.3%, reflecting the country’s weak domestic demand. Credit issues continue to plague the Chinese economy with leading aluminum processor Zhongwang Holdings was declared bankrupt, leaving $60 billion in debt against $30 billion in assets to sort out. Other bad signs include Evergrande’s founder prepared to sell London’s most expensive home, which was bought in 2020 for £210 million and in Hong King all 800 luxury apartments were left unpurchased in a fire sale – a similar sale a year prior saw over 10 buyers for every unit. With $20 billion (officially) of non-paying property loans at the four largest banks and land sales collapsing by 40% year-on-year (vital revenue for local governments) (see right), triple-leader Xi has his hands full.
Macro: US / Europe
The Federal Reserve continued their hawkish stance regarding interest rates with a +0.75% at the November 1-2nd meeting to reach 3.75%. The pace of balance sheet decline (quantitative tightening) stayed at $95 billion per month. The market was hoping for some dovish noises during Powell’s presentation but it was all hawk. Per his post-meeting commentary, strong US employment figures will delay the Federal Reserve from easing rates, though the pace of rate increases was expected to slow in December (+0.5%) and early 2023 (at least one more +0.25%). The accelerating concern is the rapid increase in the US government debt issuance and interest expense. The US Treasury said that it expects to issue $550 billion in debt in the fourth quarter, up $150 billion from an August estimate, primarily due to changes to projections of fiscal activity, weaker prices on marketable securities (AKA higher interest expense) and lower non-marketable financing (AKA lower contributions from the social security trust fund). Politically, with the national debt at $31 trillion (up from $23 trillion at the start of 2020) and the US government’s borrowing limit at currently $31.4 trillion, there will be political fireworks before the end of the year, regardless of the election results. European Central Bank raised rates to combat inflation (+0.75% on October 28th for a 1.5% overall rate), but delayed the reduction of its balance sheet. The UK may halt further rate hikes (the BOE has been more aggressive than the ECB, reaching 3.0% after its latest increase) but started its quantitative tightening.
Consumer Price Inflation and Employment still drive central bank decision-making. US overall inflation was marked at 8.2% year-on-year with core prices jumped a larger than expected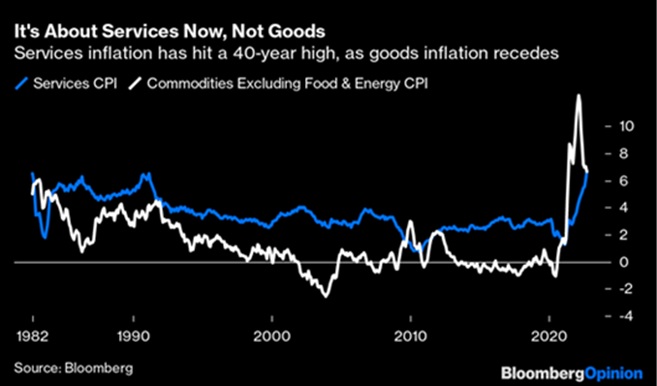 +0.6% month-on-month in September, pushing the yearly rate to a fresh 40-year high of 6.6%. Key drivers included rents rising +0.8% month-on-month, new autos leaping +0.7% month-on-month, and medical care services costs +1.0% month-on-month. Alternative inflation measures are all the rage nowadays – this one to the right focuses on services which risk being higher for longer on rising wages and strike (US railroad unions rejected their latest contract and Germany’s largest industrial union demanded an +8% pay increase). Meanwhile, Europe’s inflation rate accelerated to 10.7% in October from 10% – a record high. Germany’s rate smashed though expectations, hitting 11.6% from a year earlier versus expectations of 10.9%. The last time there were such rates was back in the 1950s.
Average People Falling Behind: to give an idea of the state of the American worker, consider this economist’s statement: “Over the past 43 years, real [inflation adjusted] wages for Americans are up 6.9%. Not 6.9% per year. 6.9% total for forty-three years.” That’s roughly 0.16% a year. Hard to get ahead on that. Alternatively, 60% of credit-card debtors say they have been in credit-card debt for at least a year, up from 50% a year ago, CreditCards.com said. The share of those who have been in debt for over two years also increased, to 40% from 32%. The current savings rate of 3.0% was the lowest since 2008 and the increase in all consumer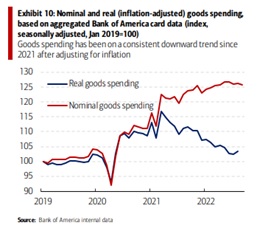 credit was at the highest rate since 2011. With prices outpacing wages for 17 months, how are consumers still maintaining their spending (the nominal spending in the graph above)? They’re saving less and borrowing more (and receiving less in exchange). Also, in a single year, the percentage of American adults living with friends or family went from 11% to 18%, the highest on record. The question is for how long can this continue?
Unemployment stayed low with the US officially at 3.7% and an increase of hourly earnings of +0.4% (+4.7% over the trailing twelve months). Underemployment was similar to last month at 6.8%. Overall payroll gains were still good, but declining month-on-month. A trend to monitor is that over half of working Americans have considered holding multiple jobs to pay their living expenses (38% have looked for a second job, while an additional 14% have plans to do so). While tech companies may grab the headlines, the quieter layoffs will be the ones to monitor.
David Burkart, CFA
Coloma Capital Futures®, LLC
www.colomacapllc.com
Special contributor to aiSource