
Ukraine: Summer Offensive?
The Ukraine-Russia Conflict may be hitting a new phase with some noises around a Ukrainian offensive – certainly the Russian push at Bakhmut was a pyrrhic victory at best. It is too soon to know. In mid-May the Ukraine Black Sea grain deal was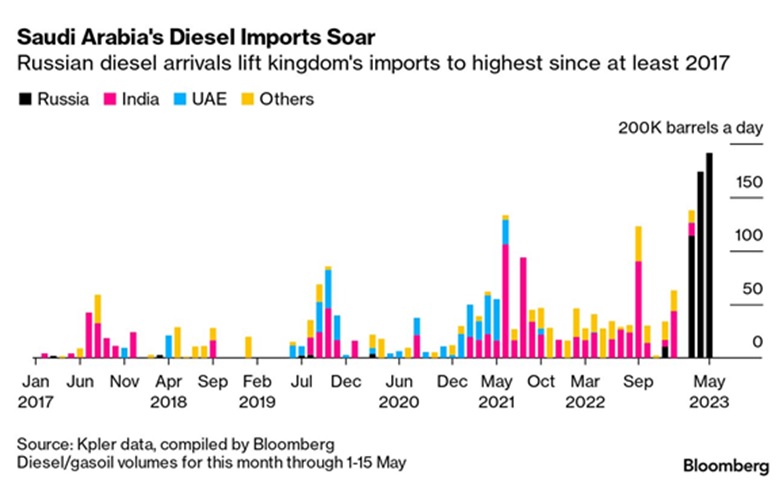 extended for two more months, a day before Russia could have quit the pact over obstacles to its grain and fertilizer exports. However, Ukrainian exports have been slow to restart so their trade situation remained difficult. Ukrainian crop production was expected to decline versus last year by 10-15% for wheat and corn and ~25% for barley and sunflowers as acres under till declined.
Russia Exported Near-Record Crude Oil, at odds with its pledge to cut production by 500,000 barrels per day as well as the June OPEC+ targets. Oil exports jumped back above 5.2 million barrels per day (mbpd) in April, with 2.1 mbpd to China and 2.0 mbpd to India (which is typically refined and re-exported). Even Saudi Arabia got into the re-export game by importing Russian diesel and gasoil and exporting its own production to Europe (see right – small volume, certainly but the shift is apparent). Perhaps this is a small payoff for letting OPEC+ tolerate Russian quota cheating.
Macro: Asia
China’s Imports contracted sharply in April (-7.9% year-on-year), while exports rose at a slower pace (+8.5% year-on-year versus +14.8% from last month), reinforcing signs of feeble domestic demand despite the lifting of COVID curbs and heaping pressure on an economy already struggling in the face of cooling global growth. The graph left reinforces the lackluster trade picture over the last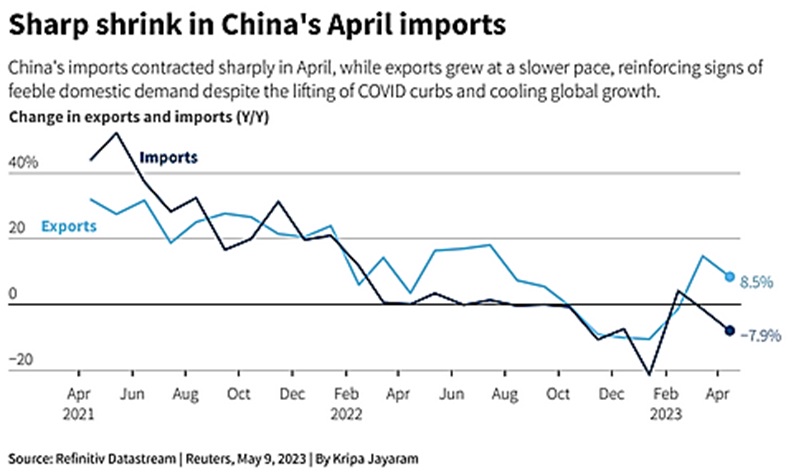 year or so, even with the re-openings of Europe and the US. Key industrial inputs of coal, natural gas and copper all lost ground. China’s exports to Russia did hit a record in April, jumping 153% from a year earlier to $9.6 billion – but that pales against the $295.4 billion of total exports. Japanese exports to China, the country’s largest trading partner, were -2.9% in April year-on-year, dragged lower by declines in cars, car parts and steel shipments.
China’s Headline Economic Activity data also broadly missed expectations. Retail sales jumped +18.4% year-on-year (vs. consensus at +21%), industrial production rose +5.6% year-on-year (vs. consensus +10.9%) and fixed asset investment growth year to date decelerated further to +4.7% year-on-year, marking a decline of -7.5% month-on-month annualized in April. Meanwhile, the unemployment rate fell to a 16-month low of 5.2%, however, youth unemployment climbed higher to a concerning new record (20.4%). While China lowered its 2023 GDP target to +5% from a missed +5.5% for 2022, analysts broached the idea that this smaller target will be missed too. The $23 trillion municipal debt market (and the $8.3 trillion real estate debt portion) have been cited as an ongoing risk as an aging population in decline erodes the tax base. One aggressive forecaster said that without the help of central government loan rollovers, “over 2/3 of the localities won’t be able to pay their debt on time.”
Macro: US
Traders Expected the Fed to hold rates steady at the June 13-14th meeting with a possible incresae in July as mixed economic data would keep a “watch-and-see” perspective. Recall that at similar time period in June 2006, the Fed stopped at 5.25% and stayed there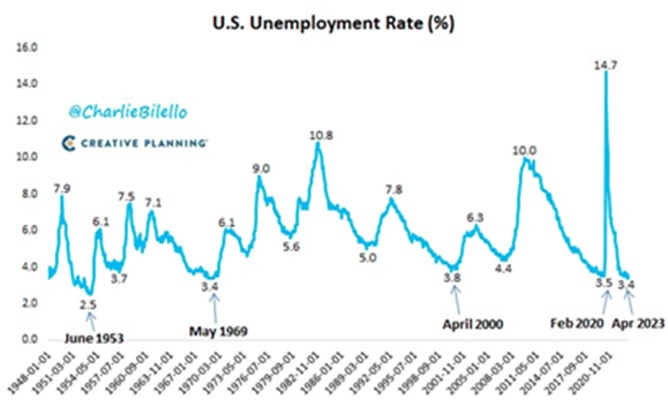 for 15 months. Unemployment was 4.6% versus 3.7% now. Nonfarm payrolls were increased up +339,000 last month after an upwardly revised +294,000 advance in April. Industrial Production held positive (+0.5% month-on-month) for April and looking ahead at Factory Orders, those increased too at +0.4% with +1.1% improvement in Durable Goods orders. US inflation showed signs of moderating in April, rising by +4.9% from a year earlier, the first sub-5% reading in two years.
 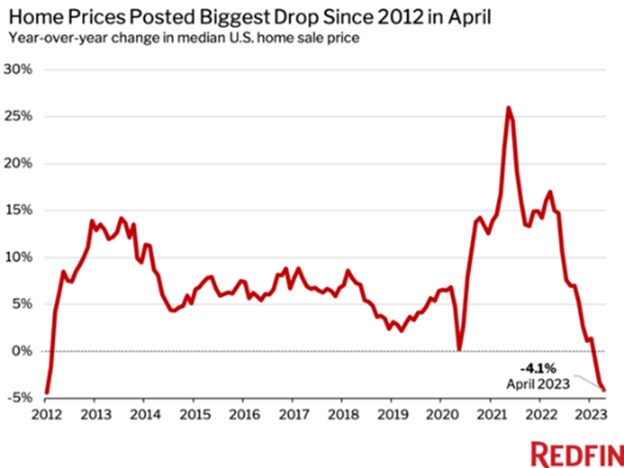 Core inflation (ex-food/energy) was up 5.5%. Both indices were lower by a fractional -0.1%. The national median existing-home price fell -1.7% in April from a year earlier to $388,800, the biggest year-over-year price decline since January 2012. April sales of previously owned homes fell -3.4% from the prior month and -23.2% from a year earlier. The graph right shows a similar story for the median of all US home sales prices. Homebuyer housing payments are +9.5% over last year, hitting a new high at $2,573 per month per Redfin.
The US Debt Ceiling Standoff was “resolved,” basically allowing the US to operate without a limit and resetting it in January 2025, conveniently after the next Presidential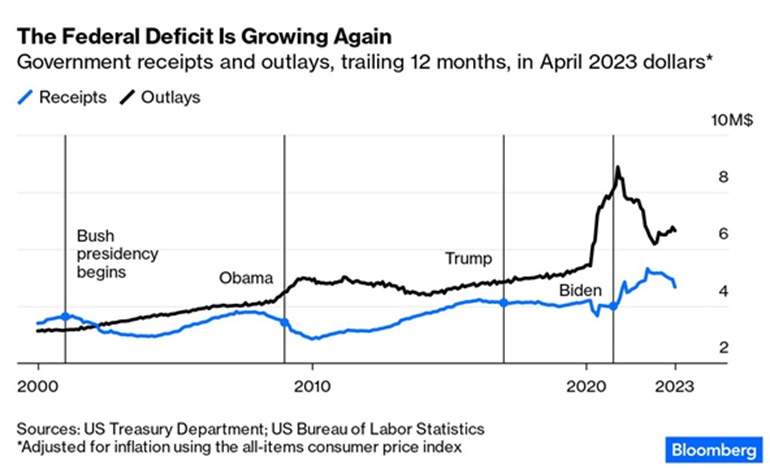 election. In terms of impact, US federal debt was forecasted to equal ~$31 trillion by the end of fiscal 2023 and one can add another $2.5+ trillion by the 2025 reset. In partial balance, non-defense discretionary spending increases were limited, but that portion only makes up 14% of the total budget. Congress and the President may say that they are concerned about the deficit – especially as interest expense continues to expand past the $1 trillion mark (currently at $826 billion over the last twelve months ending April), but the numbers show otherwise. Looking right, while the Biden administration may be enjoying higher (though now declining) revenues post-COVID, expenses have bounced off their low and trended back higher. The Atlanta Fed projects Q2 GDP growth of +2.0% annualized, at the upper end of the private forecasts – pretty good for an economy that everyone was saying was going to collapse on the Fed’s rate hikes. Let us see how long it lasts.
Macro: Europe
Eurozone Inflation moved lower in May from +7.0% to +6.1% annualized as core inflation (ex-food and energy) only shifted a little lower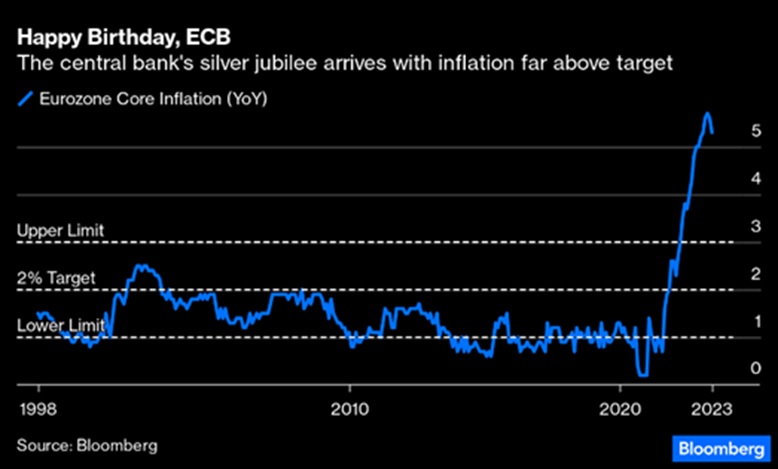 from +5.6% to +5.3% annualized. The ECB also raised rates at their June 2nd meeting and signaled for another hike to come (+25 basis points in July). QT may increase from €15 billion per month to €25 billion after July, but the ECB balance sheet was still large at €7.7 trillion or 59% of the EU GDP (double the Fed’s balance sheet at 32% of US GDP). Inflation remained stuck in a higher gear in the UK at +8.7% for April. This was a fall from March’s +10.1% rate, but the Bank of England expected +8.4%. The Bank of England’s Governor pledged to lift interest rates as far “as necessary” to get inflation back to the bank’s% target, which will also likely cause GDP to struggle. Will the rest of Europe find itself on a similar path?
David Burkart, CFA
Coloma Capital Futures®, LLC
www.colomacapllc.com
Special contributor to aiSource