Ukraine: Fall Offensive?
The Ukraine-Russia Conflict slogged forward with the Ukrainian military making little progress despite the infusion of US/EU equipment. By necessity to avoid higher casualty rates, the attack tempo stayed slow – recall that Ukraine has one-third the population of Russia and its soldiers (and citizens) have to continually punch above their weight. US officials estimated that total casualties (dead and wounded) exceeded 500,000 troops, with 300,000 Russians (120,000 deaths and up to 180,000 wounded) and 200,000 Ukrainians (70,000 and 130,000, respectively) on the rolls. The NYT reported that Ukraine has around 500,000 troops, including active-duty, reserve and paramilitary troops. By contrast, Russia has almost triple that number at 1,330,000 including the Wagner Group. Of course, to protect borders, Russia must also field soldiers in Asia and in the Caucasus, at least nominally.
With the End of the UN Deal, both sides consider grain and other shipping as valid military targets. Russian attacks on Ukrainian ports and grain silos on the Black Sea and Danube River increased in tempo, effectively blocking and partially destroying at least one-third of Ukraine’s export capacity. However, a few ships that were in Ukrainian ports have sailed, including two grain vessels and two carrying steel products. Romania pledged to double grain shipping capacity into its primary port at Constanta in the coming months to 4 million tons, about 10% of grain available for trade in the 2023 season. Overall, Romania facilitated the transit of more than 20 million tons of grain, about half of the entire 41m tons shipped this season. The Ukrainian Grain Association raised its grain and oilseed harvest forecast by 3.7m tons to 80.5m tons on better than expected yields helped by favorable weather, much higher than the 73.8m tons of grains and oilseed harvested in 2022. Recall that Russia also enjoyed a bumper crop this year that it is using to capture Ukrainian markets. Russia shipped 4.4 million tons of wheat in July, a record for the month and almost 60% above average, according to consultant SovEcon. With limited talks now occurring, it is possible that the UN deal will be renewed, but we shall see.
In Related and Unexpected War-related Occurrences, it was reported that underground storage sites in Ukraine are acting as an important additional buffer for European Union natural gas. Sites in western Ukraine are capable of storing around 25 billion cubic meters, or about 15% of annual prewar Russian supply to the EU. The EU is well-supplied so far this year at about 15% over the average, but this capacity may come into play still. Separately, Russia’s central bank jacked up its key interest rate to 12% from 8.5% at an emergency meeting to stem a sharp selloff in the ruble and resurgent inflation, a response to the mounting financial costs of Moscow’s war in Ukraine. The bank on Tuesday raised the rate a day after the currency temporarily fell past 100 to the U.S. dollar. While Russia may be enjoying strong oil export revenues to other BRICS nations, the war is taking its toll on its people and economy.
Macro: Asia
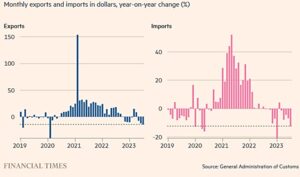
China’s Exports fell even lower year-on-year in July than the most in three years versus June, slumping a worse-than-expected -14.5% year on year as signs of stress mount from the struggling global economy and Chinese policymakers faced growing pressure for stimulus measures. Imports also fell more than expected, down -12.4% over the same period. Exports to the US also hit lows at -23.1% year-on-year – only 13.3% of US goods were imported from China during the first six months of 2023, the smallest percentage in 20 years. The graph to the right says it all. Surprisingly, crude oil imports in July fell by -18.8% from
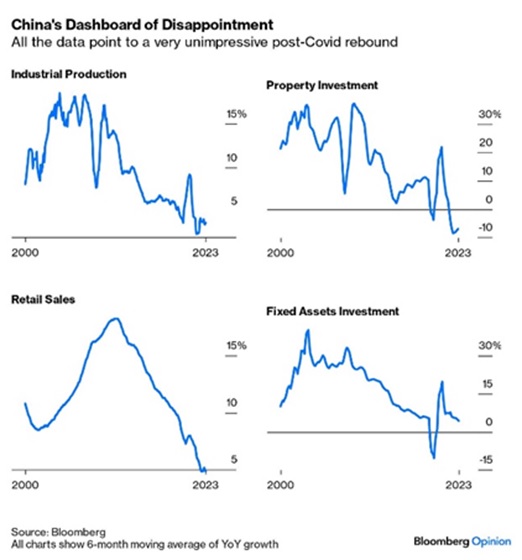
 the previous month, a pace 2 mbpd lower to 10.3 mbpd. The Chinese economy slipped into deflation, with the main price index lower -0.3% year-on-year in July versus no change in June. Pork led the way lower, falling 26% for the past twelve months. Producer prices were also under pressure, hitting company profits. Looking at the graph to the left, China’s headline economic activity data for July missed expectations again, raising concerns over the fragile recovery. Fixed asset investment growth year-to-date decelerated to +3.4% year-on-year from +3.8% in June. Retail sales were up +2.5% year-on-year (versus +3.1% in June), and industrial production rose +3.7% year-on-year (versus +4.4%). Finally, you know things are bad when governments stops reporting data… like youth unemployment, which China did last month (last print was 21.3% in June).
China’s July Property Data had an uptick in July with declines in new starts (-26% year-on-year) less bad than June (-33% year-on-year) as China’s central bank unexpectedly cut key policy rates. However, property companies are still on the brink, with Evergrande seeking bankruptcy protection against its US dollar debts after losing $81 billion over the two years of 2021 and 2022. It had ~$20 billion in outstanding international bonds and over $300 billion in total liabilities. The impact reverberated over to China’s “shadow banks” of notably which Zhongrong International Trust missed payments on dozens of products and indicated no plan to make clients whole. The firm has $5.4 billion still due this year of its $138 billion under management. Enodo Economics recently estimated credit losses at between 37% and 42% of GDP, up from 26%-31% last year, totaling from many sectors, including IT.
Macro: US
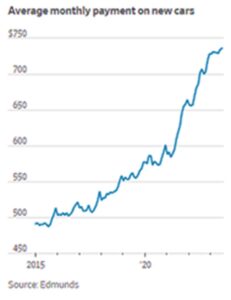
To Quote Fed Chair Powell at the Jackson Hole conference in late August, “Although inflation has moved down from its peak—a welcome development—it remains too high. We are prepared to raise rates further if appropriate, and intend to hold policy at a restrictive level until we are confident that inflation is moving sustainably down…” Year-ahead inflation expectations increased to 3.5% in August, worse than preliminary estimates and still well above the Fed’s target level of 2%. Compounding the rate question were the high Atlanta Fed estimates of real Q3 annualized GDP growth of +5.6%. Official Fed GDP growth projections are expected to increase, perhaps at the next FOMC meeting on September 19th and 20th. Higher GDP growth implies that the economy has the capacity to handle higher rates for longer to deal with persistent inflation. High rates continued to squeeze the American consumer with growing credit card balances surpassing $1 trillion (with rates at a record 20.7%), new car loans rates at 9.5% (and the cost of a new car has skyrocketed with an average transaction price of $46k, a +31% increase over the last year for a monthly payment of $750 – see graph right), average used car rates above 13.7% with seasonalized rates of severe delinquency for auto loans the highest since 2006, median housing payments as a percentage of median income at 43.2%, just shy of the high of 43.7% and mortgage rates hanging around 7.2% (effectively trapping people in their homes with many home loans in the 3-5% range) rates last seen in 2000. And don’t forget that student loan repayments started on $1.8 trillion of debt to an average of $400 per month…
Inflation Low But Headwinds Exist as energy costs move higher and unemployment stays low. With a headline of +3.8% and core of +4.7%, inflation looks to stay as gasoline moved higher to a national $3.82 average, the highest level of the year. At least US real wages are moving higher, with annual increases reaching +1.1% over the current inflation rate. US unemployment at 3.8% was a move higher but that masked that still half the US states are at or near record lows. The unemployment rate largely reflecting a pickup in participation (i.e., more people entered the workforce looking for jobs), strike action (the film industry the most notable) and bankruptcies, affecting ~195,000 positions overall. August’s nonfarm payrolls still rose by 187,000 after the prior two months were revised significantly lower. People were still spending with retail sales at +0.7% for the month of July, however.
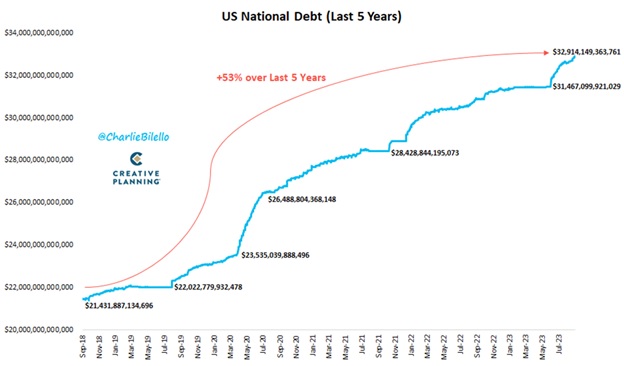
The US Debt Trend remained relentless, has now increased by $1.45 trillion since the debt ceiling was suspended 3 months ago and fast approaching $33 trillion. In the past five years the national debt has increased by 53%, from $21.4 trillion to $32.9 trillion, as illustrated in the graph below:
With today’s Treasury rates ranging from 5.5% at the front end out to about 4.25% at the 30-year maturity, annualized Federal government interest payments will soon pass the $1 trillion mark. The US is now spending 44% of GDP per year, the same levels as during World War II. Actually, in 2020 due to COVID largess, the US spent a record breaking 54% of GDP in one year. With Congress out for August recess, September will see the political budget battles heat up as Republicans generally want to cut spending to get the deficit lower while Democrats want to spend more to stimulate the economy. Going to be ugly.
Macro: Europe
European Central Bank Head Christine Legarde also iterated at the Jackson Hole central bank conference in August that European rates will stay higher for longer as European inflation remained at higher levels than in the US, at +5.3% for both headline and core rates in August. Energy costs and lower electricity and gas subsidies were major contributors. Meanwhile, in the UK, the numbers stood at +6.8% and +6.9%. The EU jobless rate stood at 6.4% in July, remaining at the record-low level reached in May. However, EU year-to-date GDP growth remained subdued, barely growing for 2023 overall. Economists now expect the currency union’s real GDP to grow by 0.6% in 2023. The real drama was on Europe’s periphery as Turkey raised rates by 7.5% to 25% in an attempt to curb forecasted inflation rates of 62% for 2023 and 33% in 2024, about triple what the government projected a year ago. At least that is better than 2021’s 85% inflation rate…
David Burkart, CFA
Coloma Capital Futures®, LLC
www.colomacapllc.com
Special contributor to aiSource

