
COVID-19
- While the COVID Toll on Q2 GDP met negative expectations, Q3 began looking up. Recall for Q2 that the US QGP fell about -9.0% for the quarter, Europe declined -12.1%, Japan’s lost -7.8% and China grew officially at +3.2%. Looking ahead, the Atlanta Fed’s projection for Q3 GDP was just under +8% for the
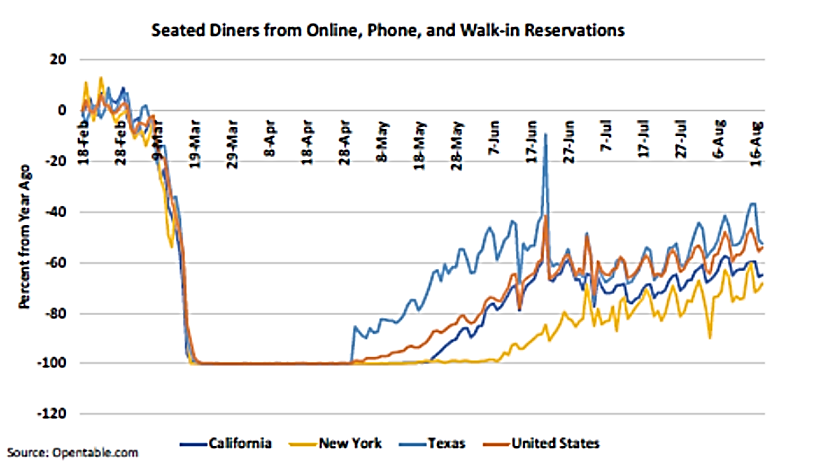 quarter as a number of states reduced economic and social restrictions. The seated diners per opentable.com recovered about half the level of a year ago (see right), and this is with some of the most populous states still enforcing severe restrictions (e.g., no or 25% indoor dining, etc.). Optimists cited the US case count and percent testing positive trending back to the June lows as supportive to this forecast and more for Q4 and 2021. Although Europe saw a pick-up in their case counts in August, the death rates stayed relatively low and their Q3 recovery was projected to be close to the US number. Japan’s expectations exceeded +10% quarterly growth in Q3 while China should also have a good print.
- Recovery Was Not Free as global debt exceed $258 trillion at the end of Q1 per the Institute of International Finance, hitting a new record in total value as well as relative to GDP (331%). Debt in mature markets reached 392% of GDP (vs 380% in 2019) as Canada, France and Norway saw the largest increases. EM debt surged to over 230% of GDP in Q1 2020 (vs 220% in 2019), largely driven by non-financial corporates in China. While still low, defaults were on the rise as the face value of defaulted non-financial corporate bonds jumped to a record $94bn in Q2. Q2 GDP declines and debt increases will worsen these ratios but they should start to recover during the remainder of the year. The World Trade Organization’s August data suggested that global trade volume in goods, while continuing to contract through the third quarter, started to show signs of recovery. Its “goods trade barometer” hit a record low at 84.5 in June, down 18.6 points from the same period last year (a sub-100 reading indicates below-trend growth). However, higher-frequency statistics improved. For example, port calls of container ships were still down -7% y/y at the beginning of August, but that marked an improvement over the -11% y/y decline registered in May. All-in-all, still a lot of work to be done but looked to be heading in the right direction.
- Regardless of Country, our thoughts and prayers go out to those taken ill and we hope that they have access to proper care and recover fully.
Macro: US
- Supporting the Friendly Q3 GDP was a host of economic data. US unemployment for July fell to 10.3%, a 0.8% improvement and came in at an even lower 8.4% for August. This is still too high, especially considering that the number of unemployed is about nine million more than in pre-pandemic February. The broader underemployment rate also improved (from 16.5% to 14.2%) and the employment-population ratio likewise improved from 55.1% to 56.5% (though still below February’s low of 61.1%). The race between business re-openings (or not) and the ending of unemployment benefits (or being renewed with additional government stimulus) will play a key role into the election. At least the US political parties have verbally decided on a spending package to maintain government functions through the election, though not so far on a follow-up stimulus spending agreement. With one side willing to spend up to $1.3 trillion and the other holding out for $2.2 trillion or more, a large gap remains.
- In other economic data, various industrial measures all showed good-sized increases: durable goods orders rose +11.4% (double estimates – and core non-aircraft, non-military also increased by more than expected) in June and +6.4% in July (beating forecasts slightly) and July’s industrial production rose +3.0% with June’s number revised upward as well. On the home front, existing home sales increased the most on record in July to a 5.86 million annualized rate, a +24% increase. Retail sales rose +1.2% in July, less than expected but June’s improvement was increased to +8.4%. Personal income and spending also improved more than forecast in July. Household debt declined for the first time since 2014 as credit card balances fell $76 billion, the steepest decline on record.
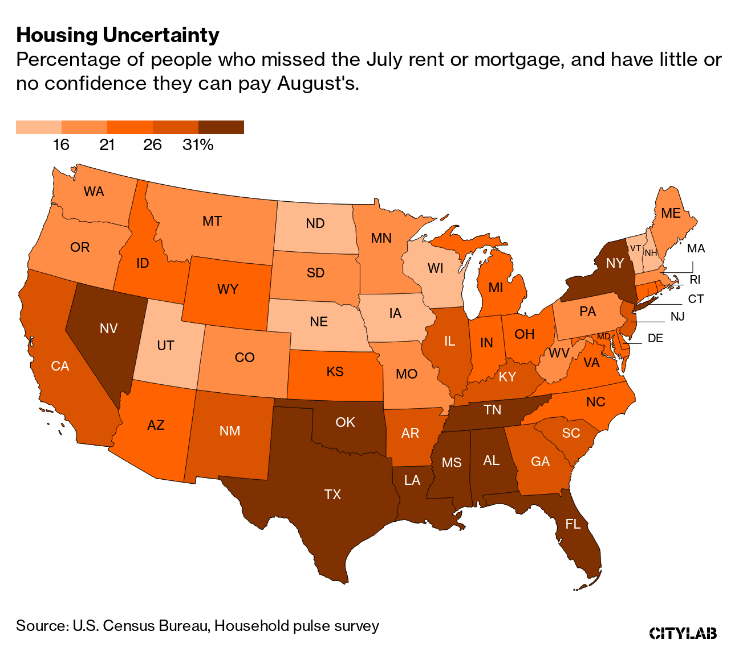
- Delinquency statistics improved but only because of the temporary stay provided by the government’s relief bill passed in March. As that expires, more Americans will face foreclosure. Per the US Census Bureau, about 27% of adults missed their rent or mortgage payment for July. Among renters, just over one-third (34%) said that they had little to no confidence that they could make their August rent payment (see the state-by-state breakdown to the right).
- Although the Next Fed Meeting is not until mid-September, the US central bank made a major announcement at its Jackson Hole conference at the end of August. There, Chair Jerome Powell revealed a new policy that would take a more relaxed stance on inflation. He said the Fed would no longer look to limit inflation to 2%, but instead will seek average 2% inflation over time (how much time?), which implies periods of higher (much higher?) prices increases at the store. Long bonds sold off dramatically before recovering slightly by the end of the month. Other Fed officials looked to calm the market saying that they were not looking to overshoot by much. We expect further discussion at the upcoming meeting. Although US consumer prices rose by more than expected in July (+0.6% m/m), annual core inflation is still low at +1.6%. With more high-profile job cuts announced in August (United Airlines: 16,000, American Airlines: 19,000, MGM Resorts: 18,000, Coca Cola: 4,000, Salesforce.com and Microsoft: 1,000, Hess Corp (oil producer): 1,000 and Bed, Bath and Beyond: 2,800), wage pressure for higher prices seems unlikely in the near term.
Macro: Asia
- China’ Slow Recovery Continued as retail sales were down -1.1% y/y in July – the seventh straight month of decline but an improvement from June’s number. Industrial production held growth to +4.8% y/y in July, the same pace as in June, as external demand assisted. Vehicle sales improved y/y as seen in the
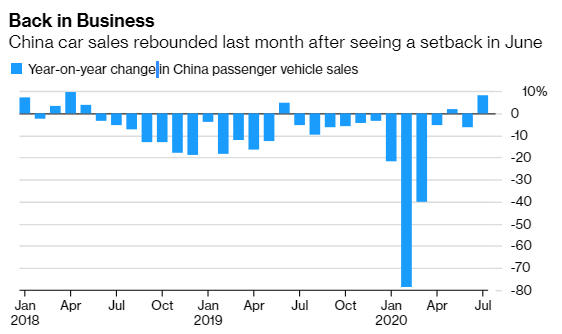 graphic on the left. Fixed asset investment fell a less-than-expected -3.1% in the first half from the same period in 2019. The unemployment rate was at 5.7% in July, down from the YTD high of 5.9% in May, although still well above that of recent years. China’s imports in June surprisingly fell -1.4% from a year earlier, while exports, fueled by the US at +12.5%, rose more strongly than expected at +7.2%. Globally, China’s share of exports fell in 2019 by 3% to 22%, though it still dominated in consumer goods at 42% (down 4% y/y). Chinese lenders however, saw large declines in net profits as provisions for bad loans rose by 656 billion yuan ($96 billion). The banking regulator said banks will dispose of 3.4 trillion yuan ($500 billion) of such loans this year, up almost 50% from 2019. Credit growth slowed as usual at this time of the year but remained much higher than in 2019 (1.7 trillion yuan ($243 billion) in 2020 versus 1.3 trillion yuan ($190 billion). Broad M2 money supply grew 10.7% from a year earlier, underscoring the unremitting stimulus needed to maintain China’s economic growth and perceived stability. The US-China trade/financial conflict continued with the US moving to demand that China companies disclose their financials at the same level as US and other foreign companies – for the last two decades, Chinese firms have gotten away with laxer reporting standards though a number of frauds (the most recent being $300 million in revenue fabrication by Luckin Coffee) and overall tensions have changed the attitude of US authorities. Currently listed Chinese companies would have until Jan. 1, 2022, to come into compliance.
- Australia’s Experienced Its First Recession since 1991, falling -7% in Q2, deeper than the -5.9% expected. It seems that China’s record copper imports failed to buoy the country. Japanese exports were up over 10% m/m to ¥5.4 trillion ($51 billion) in July, marking the third consecutive month of gains. On a yearly basis, exports fell by 19.2% y/y, an improvement from -26.2% y/y in June. Factory output rose +8% from the prior month, the economy ministry reported, the biggest gain going back to 1978. Analysts had projected a 5.0% rise overall. Industrial activity-related improvements in July were seen also in Singapore and Taiwan.
Macro: Europe
Europe Put In Mixed Performance again with July retail sales falling against June despite the lifting of COVID-19-related restrictions on economies. Eurostat said retail sales in the 19 countries sharing the euro fell -1.3% m/m for only a net +0.4% y/y rise. Economists polled by Reuters had expected a +1.5% monthly gain and a +3.5% annual increase. The Eurozone had deflation in August with prices falling -0.2% y/y for the first time since May 2016. Undoubtedly the ECB will continue its negative interest rate policy and financial repression when it meets in early September. Industrial production rose +9.1% m/m in June, th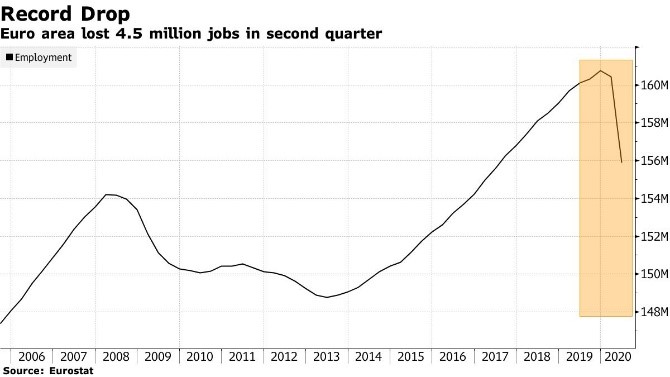 e second consecutive month of growth, following contractions from February-April period. German production and exports were notably positive. While the EU had a bad Q2 as mentioned above, the UK was over twice as bad, falling a record -20.4% q/q. Fortunately, June’s number was +8.7% m/m so hopefully this will continue. Is Europe recovering? Yes, but just as GDP growth was anemic before the pandemic, there is little to suggest that a new age of prosperity is coming.
David Burkart, CFA
Coloma Capital Futures®, LLC
www.colomacapllc.com
Special contributor to aiSource