
Ukraine: Winter & Sanctions Impact
The Ukraine-Russia Conflict ground on as Russia’s larger numbers weighed on Ukrainian defenders. Leaked US intelligence documents indicated Russia suffered 100,000 casualties and 20,000 deaths this year so far, about 30% of the additional called-up forces over the last six months or so. The report stated half were Wagner Group mercenaries with the remaining half as regular army, though not known if full-time (experienced) or conscript (barely-trained) troops. Ukrainian casualties were not enumerated but as sheltered defenders and having given up only limited ground in Bakhmut, the numbers I would guess at being 1/4th to 1/3rd the Russian losses. However, even at that rate, Ukraine will find it difficult to maintain combat operations given the country has only 1/3rd the population of Russia and Russia can securely import and produce weapons for its forces, out of the reach of Ukrainian armaments. Until now, Ukraine may have had little choice but to fight a defensive war of attrition. However, to “win” (e.g., to take back the eastern and southern areas, though not likely Crimea), Ukraine has to shift to an offensive war of maneuver, like that seen last autumn east of Kharkiv. Will Ukraine be able to take the remaining parts of the oblasts of Kherson, Zaporizhzhia, Donetsk and Luhansk, or will Russia’s advantage in bodies deny Ukraine these regions? Too soon to know.
Russia Exported a Near-Record Crude Oil, at odds with its pledge to cut production by 500,000 barrels per day. Specifically, exports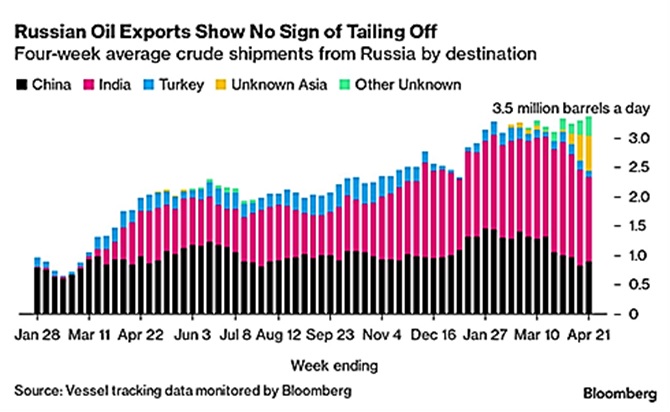 jumped back above 4 million barrels per day (mbpd) in the week to April 28, a level surpassed only once since the invasion in February 2022, according to tanker-tracking data compiled by Bloomberg. Where is this oil going? For one, China increased its purchases of Urals-grade oil which is shipped from Russia’s Baltic and Black Sea ports, while as the graph to the right indicates “unknown” as a growing category. India’s Oil Secretary Pankaj Jain admitted some barrels are being purchased above the G-7 price cap but no consequences were cited. The fuel (monetary and otherwise) for the war machine flows freely.
Macro: Asia
China’s Economic Data for March had some pleasant surprises, with exports up +14.8% from a year ago, snapping five straight months of declines and stunning economists who predicted a -7.0% fall in a Reuters poll. But analysts say the jump was more likely related to exporters rushing to fulfil a backlog of orders that had been disrupted by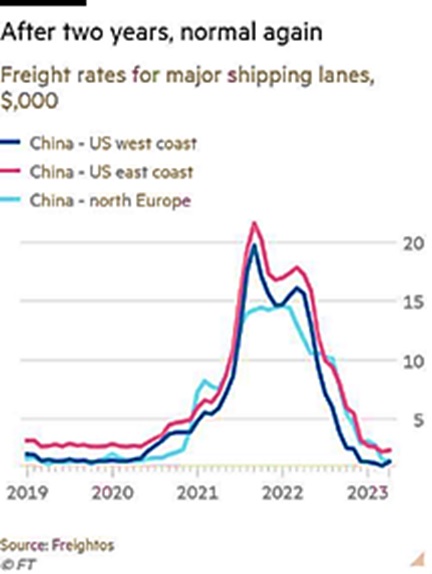 the pandemic in past months, and warned the global demand outlook remained subdued. Imports dropped just -1.4%, smaller than the -5.0% decline forecast and a -10.2% contraction in the previous two months. Increases in crude oil, iron ore and soybeans imports in the month were offset by a decline in copper imports. Freight rates indicate that shipping is no longer an issue (see graph right) but also foreign demand for Chinese goods may be stagnating. Also of interest is the share of traded goods settling in Renminbi is increasing, reaching about 23% at the end of Q1 2023 from a low of 11% back in 2018. Part of this can be explained by the emerging countries in the Belt-and-Road system trading with China but also that the oil producing countries (e.g., Russia, Saudi Arabia and Iran) are adopting the Chinese currency for their oil exports to China and buying Chinese goods in return. While some may panic over the diminished status of the US dollar for use in trade, this is the natural result of the US shifting from an energy importer in exchange for US dollars to an energy exporter. China’s voracious energy (and commodity) import appetite and ability to supply goods simply accelerates this shift.
Chinese Q1 GDP increased +4.5% year-on-year (versus consensus +4%), buoyed by a +10.6% jump in retail sales (vs. consensus +7.5%). Industrial production rose +3.9% from a year ago (versus consensus +4.4%). Fixed asset investment growth surprisingly decelerated to +5.1% (vs. consensus +5.7%), down from +5.5% in January-February. Meanwhile, the unemployment rate fell to a seven-month low of 5.3%, but youth unemployment climbed to 19.6% in March from 18.1%. Perhaps fodder for an invasion of Taiwan. Property was mixed with floor space completions up +15% over the last twelve months, but new construction still negative at -19% over the same time period.
Macro: US
No April Meeting But the Fed held to expectations at the beginning of May meeting by raising rates by +0.25% and Powell defiantly held to a neutral position for the timing of any cuts. Remember, “no change” does not equal a pivot to cuts, which the markets keep promoting. Looking back at similar time period in June 2006, the Fed stopped at 5.25% and stayed there for 15 months. Unemployment was 4.6% versus 3.4% now, core PCE was 2.6% vs 4.9% now. Based on these two simple metrics, is the case for higher rates for longer as strong if not stronger now than in 2006?
US Labor Showed Strength in April with the unemployment rate slipping to 3.4% from 3.6% and average hourly earnings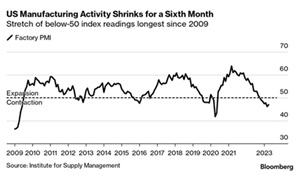 moving higher than expected (+0.5% for the month versus +0.3% expected). The employment-population ratio for those ages 25-54 (prime-age workers) rose to 80.8%, the highest since 2001. Other metrics showed slowdowns, such as in the manufacturing survey (see graph right). US real GDP growth came in at +1.1% annualized in Q1, undershooting expectations of a +2% advance, with inventories slicing 2.3% from headline growth. Meanwhile, consumer borrowing increased in March by $26.5 billion and more than expected on one of the largest spikes in credit-card balances on record. Is the consumer confident or
 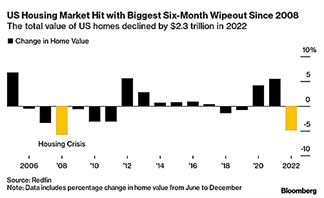 desperately trying to stay afloat? The loss in housing implies more the latter than the former (see left). Finally, adding further injury, the Biden administration added fees for homebuyers with good credit and higher down payments to subsidize those with riskier credit ratings. How is penalizing saving for a purchase and paying your bills on time a positive for society?
The US Budget Battle Lines finally were drawn as Treasury Secretary Yellen announced that the US government could run out of funds by the beginning of June, though corporate taxes paid by June 15th would extend the timing. Basically the Republicans want to cut spending and maintain a slow rise to the debt ceiling while the Democrats want to spend at a higher level and increase spending at a higher rate. Biden and his Congressional counterparts / opponents have busy travel schedules in May so how much time is there really available to make a deal? Expect volatility.
Macro: Europe
Eurozone Inflation ticked higher in April from 6.9% to +7.0% annualized as core inflation (ex-food and energy) ticked lower from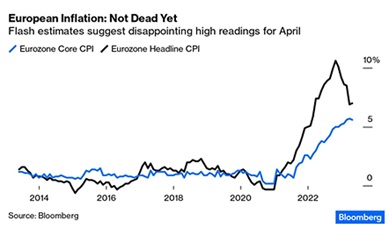 +5.7% to +5.6% annualized. Like the US, but a bit behind, the European Central Bank increased interest rates by a quarter-point at their May 4th meeting and reiterated that more increases and QT would continue. Lagarde sounded more hawkish than Powell, a surprise historically. Analysts projected that two more +0.25% increases were likely by July and that QT will increase from €15 billion per month to €25 billion after July. European growth barely registered as positive in Q1 (+0.1% for the quarter), also seen in the demand for loans falling off suddenly, reaching the low levels seen in 2008 and 2012. Unemployment moved lower from 6.6% in February to 6.5% in March, holding strong like that seen in the US. Higher rates for longer – sound familiar?
David Burkart, CFA
Coloma Capital Futures®, LLC
www.colomacapllc.com
Special contributor to aiSource