
Trade War Tempest or Just a Squall?
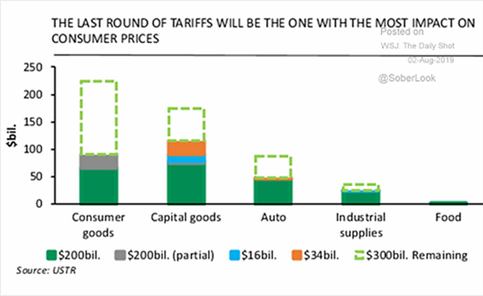
- As the July 31st Fed interest rate cut was quickly overrun by the trade war tit-for-tat, we need to gain some perspective on expected impact of the US/China interaction in early August without the hype too often seen in the media. On August 1st, Trump stated that he intends to place a 10% tariff on the remaining $300 billion-ish in Chinese exports to the US as of September 1st. The prior statements were a 25% tariff (notably higher) and at an indeterminate date (easily ignored by the markets).
 A lower tariff that can possibly be fully absorbed by Chinese firms may ruffle some feathers but would not be a crisis. The Chinese response of cancelling nebulously-defined agricultural sales (note that pork shipments are full speed ahead, despite the existing Chinese tariff) would be partially matched off with lower US grain production from the poor spring weather. There are also some reports that the Chinese tempered their Brazilian soy purchases which implied intrinsically lower Chinese grain demand. In other words, this first response was justification for something they wanted to do anyway. In addition, the Chinese allowed their currency versus the dollar to dip below the psychologically critical 7.00 level. This action would have several effects – to help Chinese exporters absorb US tariffs and discourage imports from the US would be an obvious answer, but the CNY cannot slide too far without negative consequences. At the end of last year, there was officially $1.9 trillion in foreign-denominated debt, which becomes harder to service as the CNY loses value. Furthermore, $1.2 trillion was listed as short term, coming due in 2019. Daiwa Capital Markets estimated that the real foreign debt is between $3 trillion and $3.5 trillion due offshore borrowing in Hong Kong, New York and the Caribbean. If true, foreign-denominated debt owed by China would be equal to all of its vaunted foreign exchange reserves, which have not grown for the last three years. Finally, if China sold off all its US Treasury bonds, ($1 trillion roughly), what would it do with the money? If the government brought it back to China (buying CNY, selling USD), that would reverse this devaluation and undermine their own action. Our conclusion? Both sides jabbed each other but no truly dangerous consequences… yet.
OPEC Oil Production
- hit an eight-year low in July as Saudi Arabia deepened cuts and losses caused by US sanctions on Iran and outages elsewhere in the group reduced output by about 800,000 barrels per day to about 29.4 million barrels per day (mbpd). This is the lowest level since 2011. Oil prices were flat in July but have collapsed so far in August to almost $52 per barrel from $57. OPEC+ confirmed their production restraint by extending cuts by nine months into March 2020. Russian oil production fell slightly to 11.14 mbpd in July as Russian pipeline monopoly Transneft failed to fully replace European oil supplies following the major Druzhba oil pipeline contamination earlier this year. $2.5 million more in damages were paid by Russia, this time to Ukraine. Interestingly, this pipeline contamination opened the door for some US crude oil to make it all the way to Ukraine via the Black Sea. Iraqi oil exports rose to 3.6 mbpd in July after pumping 4.6 mbpd, the highest since Jan 2017. Finally, Iran is in in the center of everything geopolitical. The country grabbed three oil tankers on various charges of smuggling, included one under the British flag as retaliation for the UK seizing an Iranian tanker heading to Syria in violation of sanctions. The UK increased its naval forces in the region to convoy British ships through the Strait of Hormuz, a chokepoint for interdiction. Iran is engaged in its own smuggling with China which had accelerating purchases despite US sanctions, reaching somewhere around 350,000 bpd in July from 250,000 bpd in June. The Singapore paper, The Straits Times, reported twelve Iranian tankers loaded after May 2nd delivered oil illicitly variously to China, Syria and Turkey. In June, after the end of the exceptions or waivers, oil ships in Iranian ports loaded about 500,000 bpd, per analysts. Also, an unknown amount of Iranian oil is sitting in storage tanks in China – but in Iran’s name and thus technically not in violation of sanctions. At least twenty million barrels is sitting offshore in tankers from Iran as well. All told, an estimated 110 million barrels of Iranian crude oil is stockpiled around the world between idle tankers and onshore storage tanks, much higher than the previous levels of 24 million barrels estimated in May. That potential supply will weigh on oil prices. Meanwhile US sanctions have stranded four Iranian ships that cannot pay for fuel – for example, two Iranian bulk carriers that came to Brazil carrying urea and were expected to return home with corn do not have enough fuel as Brazilian state oil firm Petrobras refused to sell it to them!
US Crude Oil
- weekly numbers indicated decreased production to 12.0 mbpd of crude oil due to a continuing decline in operating drilling rigs from 793 on June 28th to 770 on
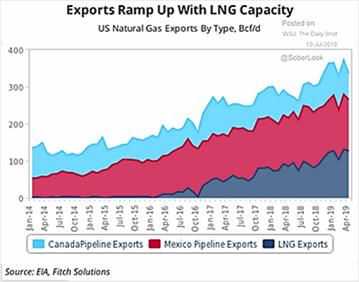
 August 2nd. Tropical Storm Barry also shut in about one-half of the Gulf of Mexico oil production in the middle of the month, disrupting US supplies. US oil output from seven major shale formations was expected to rise by about 49,000 bpd in August, to a record 8.6 mbpd. The largest change is forecast in the Permian Basin of Texas and New Mexico, where output was expected to climb by 34,000 bpd, to a fresh peak of about 4.2 mbpd in August. US crude oil exports surged 260,000 bpd in June to a monthly record of 3.2 mbpd as South Korea bought record volumes and China resumed purchases. South Korea surpassed Canada to become the biggest purchaser of U.S. crude at about 605,000 bpd. China purchased about 292,000 bpd, the most since June last year and was the third-largest buyer of U.S. crude in June. Even without those Chinese purchases going forward, the US has become an important alternative supplier, particularly to Asia as seen in the graph to the right. Philadelphia Energy Solutions formally filed for bankruptcy in July after its June 21st explosion and fire. PES started shutting down the 335,000 bpd plant and will lay off about 1,000 workers. We do not talk a lot about natural gas but rest assured that Liquefied Natural Gas (LNG) exports were growing strongly too (see graph below)! Finally, the Keystone Pipeline inched forward as a court order blocking construction was lifted.

Chinese Oil
- imports increased +13.9% in July vs last year with the first seven months of 2019 running +9.5% vs 2018. Chinese oil product exports rose +20.2% year-on-year and were up +9% through July 2019 versus the same period last year. They even reached across the Pacific Ocean to export a small amount of fuel to Mexico. Oil producer China National Offshore Oil Corp halted field work at its Uganda project over an Ebola scare. Uganda’s oilfields in the Albertine rift basin are a few miles from the latest outbreak that has killed nearly 1,700 people in the Democratic Republic of Congo since August last year.
Other Oil News
- included two updated assessments that project supply exceeding demand. The International Energy Agency predicted that surging US oil output will outpace sluggish global demand and lead to a large stocks build around the world in the next nine months. OPEC also saw lower demand in 2020 for its oil and a related surplus. Two Canadian oil producers sought government approval to boost their crude oil output if it can be shipped by rail. The amount may be upwards of 250-300,000 bpd. Brazilian firm Petrobras posted a long-awaited production boost in July after a disappointing June, as it ramped up production in the offshore pre-salt region. The oil company produced 2.8 mbpd in July, up from 2.6 mbpd in the second quarter. Brazil oil exports measured by vessel loadings rose in July to the highest this year at +6.3% month-on-month (+16% year-on-year) to 1.1 mbpd.
African Swine Flu
- devastation in China caused food prices to grow +8.3% year-on-year in June, up from 7.7% in May, the fastest rise since 2012. Culling diseased animals for food and rising imports meant that pork production is officially down only -5.5% in the first six months of 2019 versus the same period a year earlier. China’s pork imports in June surged from the previous year, up +62.8% from the same month last year. With the resumption of the trade war in August, China canceled 12,200 metric tons of US pork, which was taken up by Mexico. The US government will pay American farmers hurt by the trade war with China between $15 and $150 per acre in an aid package totaling $16 billion. Brazil’s soybean exports fell in July due to weaker demand from the world’s largest importer, China, but corn exports from the South American country hit a monthly high. Brazil’s new soybean crop planted in September is seen reaching 90.68 million acres, +2.3% larger, for an estimated output of 122.8 million tonnes, +6.8% than in the previous season. Argentine wheat farmers are preparing for a record harvest, countering expected losses amid US floods and searing heat in Europe and Australia. However, surveyors estimated harvest yields for the 2019 US hard red spring wheat crop at 43.1 bushels per acre, up from 2018. Despite the heat, France is on course to harvest 37.0 million tonnes of soft wheat this year, +8.5% more than in 2018. Finally, gold prices have been moving higher, partially fueled by eminent investor Ray Dalio and record central bank purchases during the first half of 2019. Poland, China and Russia bought a total of 374 tonnes of gold through June. Lower and negative global interest rates have made the lustrous metal more attractive, as well as geopolitical desires to diversify away from USD-related assets.
David Burkart, CFA
Coloma Capital Futures®, LLC
www.colomacapllc.com
Special contributor to aiSource