
Americas
- Economic Data for US Q4 2018 GDP was revised lower to +2.2%, as consumption grew less than forecast but everyone has moved onto Q1 2019 and the year as a whole. With the Federal government partial shut-down through January 25th, GDP for Q1 2019 is on the top of everyone’s minds. The closely-followed Atlanta Federal Reserve has been revising
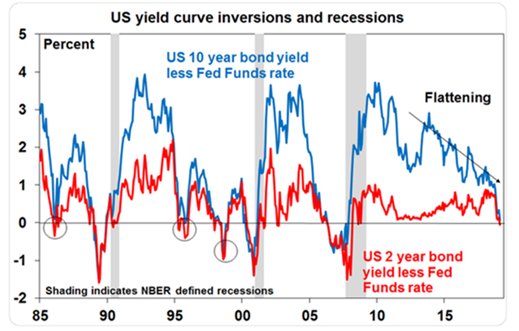 their estimate higher all month and stands currently at +2.1%, at the upper end of the private forecasts. Hiring rebounded more than forecast in March and the prior month was stronger than first reported, relieving some concerns about a cooling economy but also obviating the need for the Fed to cut rates. Unemployment stayed at 3.8% as payrolls rose 196,000, beating expectations. Wages rose +3.2% year-on-year (below expectations), implying that the wage-price inflation spiral is not a threat either. Underemployment stayed at 7.3% and participation fell slightly. The yield curve was partially inverted, maintaining slowdown talk but the signal is mixed (see circles on left graph where inversions were not directly related with recessions). At their March meeting, the US Federal Reserve stated that its balance sheet reduction program will slow starting in May and halt in September causing its balance sheet falling to about $3.75 trillion before starting to increase again in 2020 as interest is reinvested. Also, the mortgage-backed securities that it owns will be reinvested in treasuries as they mature. Finally, Powell’s report indicated that no interest rate increases are expected in 2019 instead of the two from the last report. They were dovish and exceeded already dovish expectations! From uber-hawk to uber-dove, Powell’s transformation is complete.
- US-China Trade Negotiations continued with progress but no deal. Trump deferred imposing additional tariffs on the original March 1st deadline, and a Trump-Xi
 summit at the end of March was delayed. In early April, both sides indicated that they were closer than before but were not there yet. We shall see.
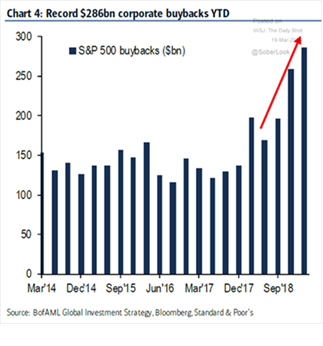
- Key Economic Barometers are getting past the government shutdown. Existing home sales popped up from their recent lows last month to rebound to the average levels of 2016 and 2017. Mortgage rates as indicated by 30-year fixed rates continued their rapid decline (see graph right) to almost 4.0% which should have been supportive to sales. Inflation figures are still showing low levels at +1.4% year-on-year, with +1.8% for core (non-food and energy) products. Core retail sales (ex-autos and gas) missed expectations at -0.6% month-on-month but that could still be just reporting fallout from government shutdown. Construction spending was stronger than expected as public construction expenditures have increased markedly, particularly for highways and streets, hitting $300 billion in Q1 2019 from $250-260b from over five years ago. Finally, there is one area where spending is strong and unabated – companies buying back their stock! Bank of America/Merrill Lynch research said that share buybacks so far this year are tracking 78% higher than in the same period last year or almost double that of two years ago. With low rates supporting more corporate borrowing and lower US tax rates, this trend should continue through 2019 and possibly in 2020. The headwind to this story is the busy IPO calendar that will absorb investor capital. The highly-anticipated Lyft offering sputtered out of the gate so far but Uber is still the one to watch.
Europe
- Europe’s Distraction Continues as the Brexit deadline was kicked down to April 12th with a possible delay to June depending on if both sides give a little… but that is still no “deal.” Personally, I feel that a “hard Brexit” or no-deal result is the most likely as both sides have set conditions that appear impossible for the other to live with. While many pundits hype up the impending collapse of the UK economy, the British unemployment rate is 3.9%, the lowest since the late 1970s and average weekly earnings for employees is the highest year-on-year gain since before the 2009 financial crisis (+3.4%). Meanwhile Ford announced plans to cut 5,000 positions in Europe – about 10% of its workforce there.
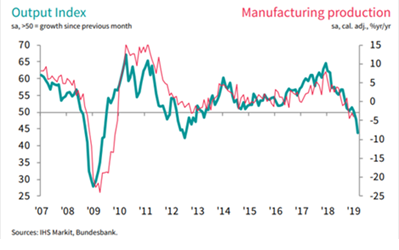 Continental Europe stumbled further as German factory orders data for February dropped -8.4% from a year earlier, the biggest plunge since 2009. See the graph to the right for the possible implication on production, though the last number was better than expectations (though still a decline). Private forecasts dropped EU GDP growth this year to +0.8%, compared with a previous estimate of +1.9%. Italy was predicted to slow in Q1 2019 with full year GDP growth of +0.1%. As 2018 real GDP was at the same level as 2004 and 4.3% less than in 2007, another year of minimal growth or even decline will be fifteen years of stagnation. Like Japan, with the decline in working age population, the flat to negative trend of real GDP is more likely to continue. For now, there are some positive signs with Eurozone retail sales up +2.8% year-on-year (higher than expected).
- In banking, the ECB capitulated and went more dovish than expected at its early March meeting. Outgoing President Draghi cut the European GDP growth outlook from +1.7% to +1.1% for 2019 and announced that there would be no rate hike in 2019 versus expectations that there would be one by the end of the year. Also, he revealed a third set of loans available to banks to promote lending to companies. Greece finally reached an agreement with the EU to receive another $1.1 billion in cash for debt relief – yes the financial crisis there still grinds on ten years later.
Asia
- Beijing Announced Easier Monetary Conditions as the Chinese banking regulator told big state-owned banks to increase outstanding loans to smaller companies by more than 30% in 2019, adding that it would increase its tolerance for non-performing loans at small companies. Factory output the first two months of the year rose +5.3% year-on-year, the slowest rate since 1995, but retail sales were reportedly +8.2% year-on-year (steady with December) and fixed-asset investment were also steady at +6.1% year-on-year. However, industrial firms’ profits fell -14% year-on-year in the same period, the biggest decline since Reuters began recording the data in October 2011. The drag was mainly due to price declines in key industrial sectors such as auto, oil processing, steel and chemicals. Finally, the unemployment rate jumped to 5.3% in February from 4.9% in December, the highest level in two years. Exports for the same period fell -12% year-on-year with imports down -13%, an acceleration of the decline in December. While one should be skeptical with Chinese statistics, it seems that they should be motivated to come to a trade deal, in addition to the bond index inclusions attracting funding and hog flu issues mentioned above.
David Burkart, CFA
Coloma Capital Futures®, LLC
www.colomacapllc.com
Special contributor to aiSource