Central banks and OPEC members vied for the headlines, though the direction was basically the same – bullish on asset prices. The ECB and Fed meet in March and the Europeans are expected to engage in significant monetary easing at their meeting on the 10th. Draghi disappointed the markets in December and since then has given public indications that he will make up for his shortcoming. Certainly he feels that his economic data gives him cover – lackluster GPD growth and whiffs of deflation. However, employment is going in the right direction at least. Therefore, I expect Draghi to cut overnight rates further as well as increase the monthly purchases of bonds with perhaps some other expansionary measures. Yellen has the opposite situation, with Q4 2015 GDP revised higher instead of lower like everyone expected. The Atlanta Fed’s GDPNow model indicates as of March 4th that Q1 2016 GDP will be +2.2% annualized which would be respectable at least. There are some signs of an uptick of inflation as well, though still well below any warning levels. Therefore, Yellen will stand pat and not look to move until at least June (April feels too soon to me, even if the US economy performs very well). China also jumped on the monetary expansion bandwagon with supporting verbiage of expansion of the fiscal deficit. The Asian country decreased the amount of capital that banks are required to hold, which expands loan capacity. On the fiscal side, the People’s Bank of China recommended that the government deficit be expanded from 2.3% in 2015 to 3.0% in 2016 (highest budget deficit since the founding of the PRC in 1949) and 4.0% thereafter. Certainly they have the assets to draw upon, though it would require the selling of foreign bond or domestic equity holdings. We shall see if the spending goes to worthwhile projects or simply delays the inevitable. Similar to last month’s March contract, the benchmark April WTI crude oil price fell to start the month, hit a low of $28.83 per barrel in the middle of the month and then recovered for a slight decline in price by the end. Oil producing countries made a broader and more concerted effort to talk up oil prices with a freeze deal outlined between Russia and Saudi Arabia. We shall see if there is a formal arrangement but the buy rumors (that keep being dispelled) kept the market off the lows. I think it is too soon to say we have reached the final depths but the short-term skew looks to the upside, especially if central banks give the markets monetary ammunition to put on risk.
Ditch Those Winter Blues: Dr. Yellen may want to keep her options open at the upcoming March 16th Federal Reserve meeting, but those pushing for a rate cut to reverse December’s move are shouting into the wind. Economic news is just too good. First, the economy is doing fine – not great, but not bad. Q4 2015 annualized GDP was revised upward from +0.7% growth to +1.0%, against expectations of a decline to +0.4%. Q1 2016 annualized GDP growth has been forecasted at +2.0% for most of the quarter, and after the labor data posted at the beginning of March, that prognosis looks pretty solid. February non-farm payrolls handily beat the survey number with 242,000 jobs created and positive revisions for both January (+21,000) and December (+9,000) as well. Unemployment stayed at 4.9% and the participation rate increased slightly, indicating that the overall labor market increased as well (a sign that there is some optimism related to finding a job). Compensation did decline slightly instead of increase slightly. Looking to the other aspect of the Fed mandate, year-on-year ending January inflation ticked up a little more than expected by +1.4% total and +2.2% core inflation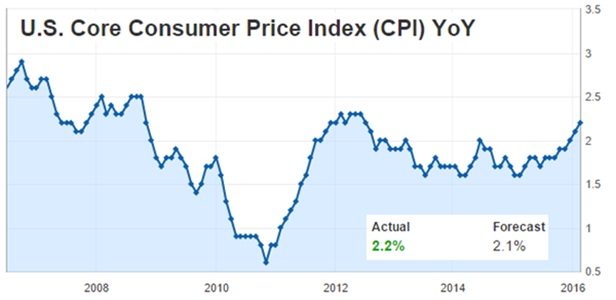 (see graph to the right). Certainly an acceptable rate even if still feeling the effects of low food and energy prices. The direction however, indicates that the Fed has no reason to cut. Poor conditions overseas means that the US continues to attract foreign funds – aside from those that need to sell assets to cover fiscal deficits (I am looking at China, the Middle East and other countries with large sovereign wealth funds). Therefore, raising rates at the April meeting seem out too. June seems the most likely candidate assuming these supportive trends continue. Later than that timeframe gets too close to the US Presidential election and the Fed will not want to be seen as playing politics. This analysis also removes negative rates here in the US in the near future. A quick look at underlying data supports the US recovery – January existing home sales were 5.47 million versus 5.32 million expected, January durable goods orders rose +4.9% versus +2.9% expected (with an upward revision for December) and January factory orders also increased, though less than expected (+1.6% versus +2.1%). There are still signs of strain in the credit markets with the government housing lender Fannie Mae at risk of needed another bailout as its capital has dwindled, partially due to government accounting policies that transfer earnings from Fannie Mae to the federal government, improving its deficit. In short, Janet can ignore the call for more QE and stay on course for the gradual, “data dependent” rate increases she outlined last year.
In South American news, Argentina reached an agreement with bond holdouts, promising to pay $4.65 billion (about half) of the $9 billion in claims. This would allow the country to issue debt into the international markets after a hiatus of fifteen years. A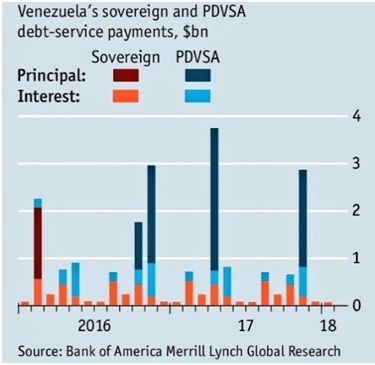 $15 billion bond issue is already in the works to cover this repayment as well as replenish foreign exchange reserves. The new Macri government is working rapidly to put the past behind them. Venezuela, on the other hand, is still in a death spiral with inflation expected to exceed 700% in 2016 as the government prints money to cover the fiscal deficit. In response, Maduro increased the price of gasoline from 0.1 Bolivars (less than 2 cents) to 6 Bolivars (87 cents) per liter or $3.30 per gallon – that is a higher price than here in San Francisco (still an outrageous $2.51 average per US gallon versus the US average of $1.81). As the chart to the right shows, there are some big debt payments due in 2016 and 2017 – a default is very likely, I believe. Maduro also packed the Venezuelan legislature by barring seats won by his opponents in the last election. The “President for Life” announcement is next. Brazil’s president, Dilma Rousseff will need to come up with something soon as Brazil’s GDP fell -3.8% annualized last quarter and in recession. Moody downgraded the country’s credit rating to junk on its lack of effective economic reform and budget deficit. With Venezuela at risk of not repaying China on its oil loans, China turned to Brazil’s Petrobras to swap debt for oil – lending up to $10 billion in exchange for repayments in dollars or oil, at China’s discretion. We shall see how good a credit risk they are as corruption scandals paralyze the ruling class.
An Exercise in Futility: Europe cannot get its economic house in order, even with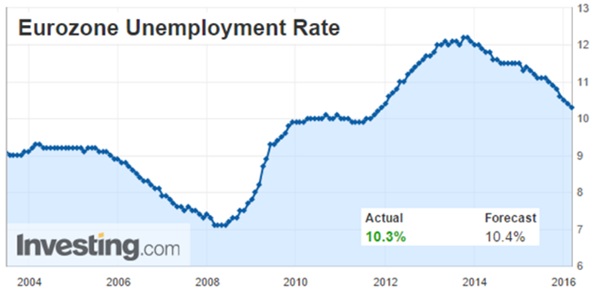 massive monetary stimulus and negative interest rates. However, that will not stop Draghi from his set course. The exact form of Q€ expansion is unknown but the ECB meeting on March 10th seems like the date for something appropriately massive. The ECB has been under fire for the last quarter for not doing more in December, so it seems that it will make up for lost time.
 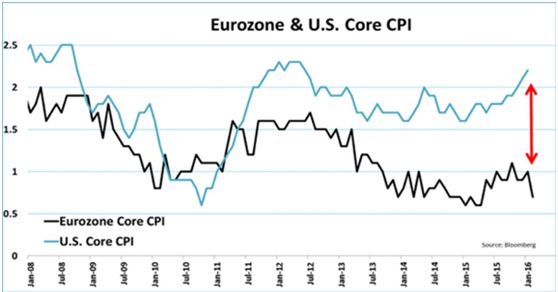 Eurozone Q4 GDP growth came in at +0.3%, putting 2015 at +1.5% growth. Our old friend Greece slipped back into recession, falling -0.6% in Q4 2015. Italian industrial activity fell -2.8%, not a good showing for the fourth largest economy in Europe. Deflation ruled in February, with prices falling -0.2% for the trailing twelve months. The graph to the left highlights the different trends in consumer prices between the US and Europe, underscoring the acceptability of different monetary policies. Negative yields dominate the continent but the trend keeps going. Germany just issued 5-year bonds at -0.4% annualized rates. In a surprise move, Sweden cut rates by -0.15% to -0.5% overnight rates. Amazingly, Swiss 30-year bonds are trading at 0.203%, less than 1/10th of the US’ 30-year bond at 2.695%. Not sure that it is doing any good as the velocity (rate of circulation) of money seems to be slowing down correspondingly. This has sometimes led to lower credit creation (inhibiting GDP growth) as seen in Denmark and Switzerland – though Swedish GDP is growing quite well. These three countries have the deepest negative interest rates in Europe. Liquidity in bond markets has declined as central banks crowd out private participants. On the other hand, unemployment has declined from the peak in 2014, though it is still a high 10.3%. Migrants so far would not be a large impact on the unemployment rate – assuming that half of the 1.4 million people that have come to Europe during 2015 and early 2016 are of working age and inclination, the adjusted rate would increase to 10.8%. An impact, but probably less than politically warranted – though we have yet to see the fiscal impact as spending increases on social programs, etc. Of course, more government bonds sold means more room for Q€!
Asian Maelstrom Gathers Strength: The negative news flow out of China and Japan appeared to increase in volume. To start, it was revealed that China sold more US Treasury bonds in December than any other month last year, cutting its holdings to stabilize its currency as well as generate cash flow for its fiscal needs. The $18 billion was about 1.5% of its $1.2 trillion holdings – not a lot by itself – but an indicator that its trade situation is not on the mend. On that note, exports declined by -11.2% in January 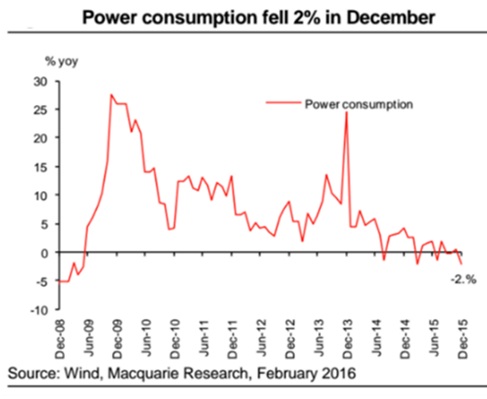 over a year prior while imports fell a trailing twelve months figure of -18%. Over-invoicing by Hong Kong companies that artificially inflates exports accelerated, doubling versus a year ago. Slightly paradoxically, China posted a record trade surplus of $63.3 billion. In summary, the size of global trade is down dramatically but China has been able to tilt the lower volume a little more in its favor. This lower activity, however, is hurting other economic measures, as for example with factory activity declining in February as measured by PMIs. Indirect measures, such as power usage, are at best stagnant (see graph to left). This is despite a massive increase in credit as new Chinese bank loans hit a monthly record of $390 billion in January. There appear to be some structural reasons for this – Chinese banks historically front-load lending to maximize booked interest income and Chinese companies reportedly have been paying down foreign debt in a bet on a weakening Yuan. This slowing factory and trade activity is expected to start hitting the employment rolls with the China government minister of human resources expecting that two million workers in the coal and steel industries will lose their jobs, tentatively forecasted over the next two years. Reportedly a $15 billion reserve fund has been set up to cover the affected laborers. Coal miner Up Energy officially defaulted on their $445 million of debt outstanding as a grace period passed in February. Moody’s reacted to the cumulative stress on the Chinese government by placing the country’s Aa3 credit rating on negative watch – no downgrade yet, but one should not be surprised. Direct central government debt-as-%-of-GDP may be only 41%, but is up from 33% in 2012 but it is the contingent liabilities of state-owned enterprises (like the steel and coal companies), banks and local governments that may total over 200% that concerns Moody’s. Bank non-performing loans rose 7% in Q4 2015 to $196 billion (5.5% of loans outstanding). Perhaps to that end, China announced a plan on March 4th to securitize bad debts by bundling together loans and selling them to foreign investors, with $75 billion as first amount. Like the collateralized mortgages that US banks sold a decade ago, one has to wonder at the true risk of these offerings. Perhaps in a telling decision, these new products will not be rated by S&P, Moody’s or Fitch. Caveat emptor!
In Japan, Q4 2015 saw a greater-than-expected drop in annualized GDP growth, falling -1.4% instead of the forecasted -1.2%, generally due to a decline in consumption (i.e., domestic demand). Actual number for the year was +0.4%, which is at least an improvement than 2014’s +0.0%. Both imports (-5.8%) and exports (-3.4%) fell. However, more recently, industrial production increased in January by +3.7%, more than expected (+3.3%). Perhaps the most telling symbol that Japan is faltering badly is that the government issued ten-year debt for the first time below zero (at -0.024%). Germany is close to doing the same (+0.13% annual yield currently) for their ten-year bonds – there is an auction on March 16th which is after the ECB rate policy announcement. Interesting times.
Oil Pool Deep End: There have been many calls for bottom in oil prices but a freeze is different than a cut, and US shale plays are different from Gulf of Mexico. The big news 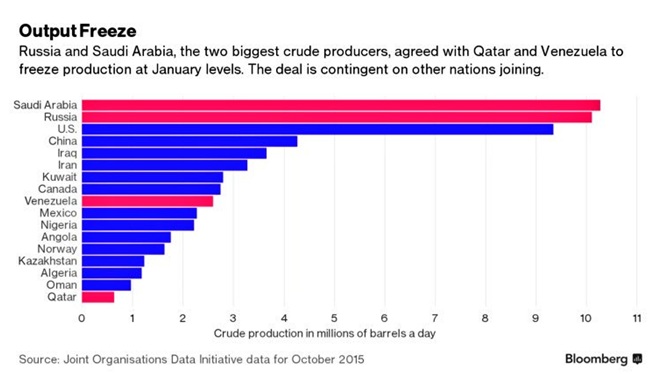 that got the bulls all excited was that Russia and Saudi Arabia agreed to freezing their production (at very high levels), at least verbally. Iran and Iraq both avoided commitment and instead made noises that they were going to further increase output (i.e., Iraq’s output hit a record 4.8 mbpd in January). Russia and Saudi Arabia both have limited capacity to actually increase output so maintenance is a realistic status quo. As the chart on the left indicates (red labels mark those countries considering the freeze), other countries are to join in for the deal to take hold. While Saudi Arabia has repeatedly stated that they will not cut output, some kind of deal could happen in that regard. Regardless of
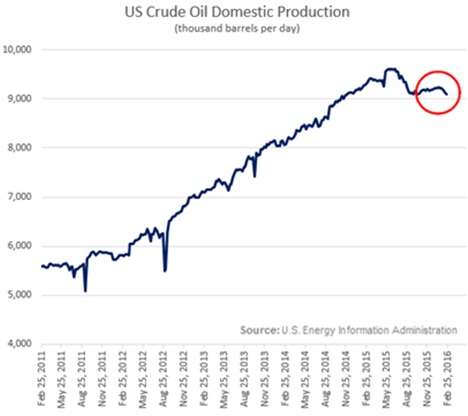 the news flow, I suspect such a deal will take until the summer at best. On the other hand, US shale production is declining as the number of oil rigs is falling rapidly – from from 498 on January 29th to 400 on February 26th (and natural gas rigs falling from 121 to 102 during the same period). At the current rig count, Goldman Sachs estimated that US production will fall about 445,000 bpd on average in 2016. The low oil prices have had a negative impact on US production so far as can be seen in the graph to the right. The estimates for March production is
 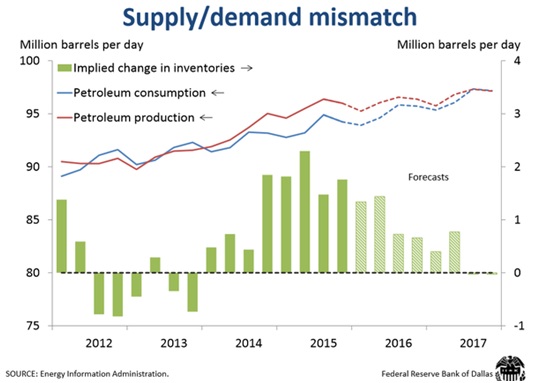 for a further fall of about 2% (93,000 bpd) from shale production versus February. Looking ahead, the correction of the difference between supply and demand still looks to take a while as global production is expected to exceed global consumption through the first half of 2017 (see graph below). The International Energy Agency painted a more sever picture with a deeper glut for the next five years as US technology spurs a production boom that reignites shale opportunities. The company effects are still unfolding as Chesapeake Energy cut investment spending by 70% for 2016 and is writing off $14.9 billion in assets. Halliburton is cutting 8% of its workforce (~5,000 positions), bringing total job cuts to 35% off of the peak employment in 2014 (about 31,000 workers). One bit of good news on oil demand is that Americans are driving more with the cheaper gasoline – trailing twelve month average miles driven ending December 2015 increased by +4.2% (10.6 billion vehicle miles), even adjusting for population growth the increase is +2.3%, an impressive number. Not enough to change everything, but humans do react to economic incentive.
Internationally, Iranian voters elected a more moderate (AKA just a little less extreme – do not think these are “moderates” in the way of Western politicians) parliament, which at best can be seen as supporting the treaty that outlines the end of sanctions. Iran will continue to pump. Russia (which kept February’s output the same as January’s) and Saudi Arabia need the money for their wars and budgets so they will continue to pump. Ditto Iraq. Brazil’s Petrobras is receiving $10 billion from China Development Bank to continue operations. Finally, the agreement does not cap other petroleum items such as natural gas or natural gas liquids (a halfway product between oil and natural gas). Oil bulls may be right for now but their parsing bots will have to dig under the surface to avoid any mis-steps.
In other commodities news, mining giant Anglo American is continuing to cut assets by $3 billion to try to reverse its downgrade to junk by Moody’s who was concerned that its operating cash flows would not be sufficient to maintain the level of its borrowings. S&P and Fitch followed the Moody’s downgrade with similar moves. Anglo cited plans to cut direct personnel to 50,000 from 128,000 at the end of 2015. 68,000 jobs are to go with the sold assets and 10,000 are to be made redundant. Sector exits include coal and iron ore, with a retained focus on copper, diamonds and platinum. Industrial metals may have recovered in the markets recently but it is a modest move so far. Such a move was not enough to save Brazil’s Vale which was also lowered to junk at the end of February. Iron ore is a particularly central product for Vale so it cannot look to exit the business like Anglo can. The turnaround in gold prices has sparked an increase in Australia’s production – reaching the highest level in twelve years. The number-two producer (China is the largest) had a full-year output of 285 metric tons in 2015, a 1% increase over 2014. A weaker currency with stronger demand has certainly reversed miners’ fortunes down under. Russia (200 metric tons), China (103 metric tons), Kazakhstan and Jordan were notable gold buyers while sellers were generally modest. It should be noted that El Salvador (-5.4 mt), Columbia (-6.9 mt) and Canada (-3.0 mt) were the largest sellers, generally due to economic pressures.
In grains, Russian exports are expected to be high in March after record supplies were 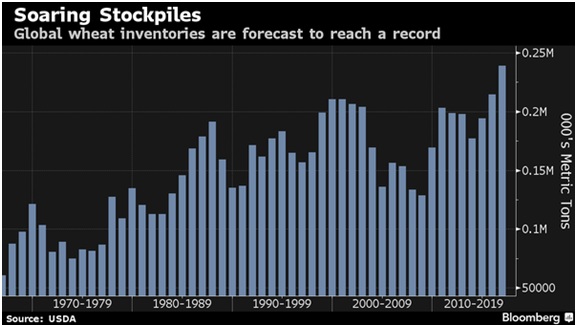 sold in January and February due to the weakening of the ruble. February was a record for a monthly total grain exports with 1.5 million tonnes of wheat sold. Globally speaking, wheat stockpiles are expected to reach a high at the end of the upcoming season per the USDA’s latest forecast. We shall see if dryness from El Niño will change this equation.
In short, there is plenty of inventory across all commodities with a few exceptions – rumor rallies will happen but it seems we have a few months to go before a real turnaround is possible. Best of luck investing!
David Burkart, CFA
Coloma Capital Futures®, LLC
www.colomacapllc.com
Special contributor to aiSource
Additional information sources: BAML, BBC, Bloomberg, Deutsche Bank, Financial Times, The Guardian, JP Morgan, PVM, Reuters, South Bay Research, Wall Street Journal and Zerohedge.
