
Comment on the Deaths
- of General Suleimani, the head of Iran’s Quds Force who was in charge of external operations (essentially supporting Shi’a terror and paramilitary groups outside Iran) and his number two militia commander in Iraq, Abu Mahdi al-Muhandis (who directed terror and combat operations against US forces and Sunni paramilitary groups, including against US enemies such as ISIS). The shadow war in the Middle East got a little hotter but military moves to a higher tempo have been in place for over a year with oil tanker takeovers, the Saudi oil facility attack, ongoing Libya fighting (especially with Turkey getting involved), etc. While WWIII fearmongering is all over the media, we feel that line will not be crossed. Iran’s economy is stumbling and a hot war with its vulnerable oil and refining facilities act as a brake to the most egregious moves. Trump has higher priorities (e.g., the US elections and the economy). Finally, China, Iran’s largest “secret” buyer of crude oil, can apply pressure to both Iran and the US around its trade negotiations. China does not want higher prices as it is the world’s largest oil importer. Other economies may be more vulnerable (i.e., India and South Korea), but China has the relevant size and influence with both parties.
2020 Oil Production
- looks to be plentiful despite lower forecasts by the International Energy Agency, which estimated a surplus of 700,000 barrels per day (bpd) in the first half of 2020 and a larger
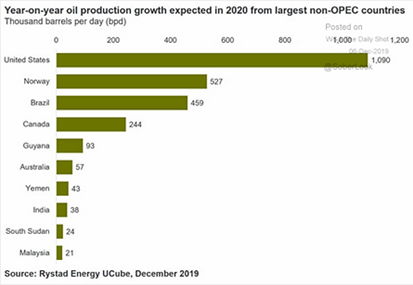 excess of 1 mbpd in the second half. Non-OPEC+ supplies led the way. Their number for total U.S. oil production growth will slow to +1.1 mbpd in 2020, down from +1.6 mbpd in 2019 and nearly +2 mbpd in 2018. Brazil, Norway, Canada and Guyana are all gearing up to deliver new flows of oil (see left). Producing regions outside of the United States will provide at least half of non-OPEC supply growth in 2020. OPEC did reduce its supply in December to 29.5 mbpd, primarily from Saudi Arabia, Iraq and the UAE. Nigeria is still producing more than their quota. Russian oil and gas condensate production hit a record-high 11.25 mbpd in 2019, beating the previous record of 11.16 mbpd set a year earlier. Mexico’s Pemex announced huge 500-million-barrel oil deposit, its biggest find in 30 years though with modest production of 69,000 barrels a day expected in 2020. More importantly, Saudi Arabia and Kuwait signed a deal to restart oil production along their border with full output of 500,000 bpd expected in twelve months. Finally, Brazil exported a record monthly volume in December of about 2 mbpd of crude, more than double the amount shipped a year ago and its highest monthly volume ever, surpassing the previous record posted in July 2018.
US Crude Oil
- estimated production held around 12.9 mbpd of crude oil as operating drilling rigs moved up slightly from 668 on November 29th to 677 on December 27th. US oil output from the
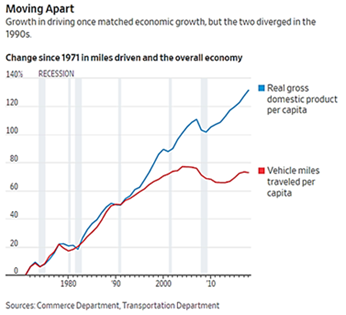 seven major shale formations was expected to rise about 29,000 bpd in January to a record 9.14 million bpd, per the US Energy Information Administration. Output at the largest formation, the Permian Basin of Texas and New Mexico, is expected to rise 48,000 bpd to a new record 4.74 mbpd, the smallest increase since July. The graph on the right is very interesting as it shows the significant decline of driving as the economy increased on a per capita basis. Producing more oil and gasoline while greater urbanization and technology reduces that dependency further supports the record high US exports of crude and products. Note that natural gas enjoyed a similar move higher in production the last ten years, going from 1.8 billion cubic feet (bcf) in 2010 to 3.2 bcf at the end of 2019. As shale fields age, they become more “gassy” so expect this trend to continue to weigh on prices and support liquefied natural gas exports.
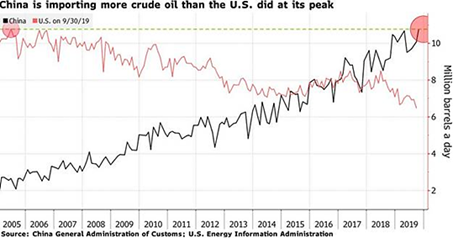
China Imported 11.2 mbpd in November
- the highest monthly figure for any country since the U.S. imported 10.77 million barrels per day in June 2005 (see graph right). China’s purchases will probably continue to rise into next year as new refineries in Zhejiang and Zhanjiang increase output, and as a widely anticipated tax rebate boosts domestic production of marine fuel. China issued the first round of crude oil import quotas for private firms for 2020, allowing non-state firms to import almost 8% higher than the first batch of quotas issued for 2019. China imported a
 record high monthly volume of liquefied natural gas (LNG) in December, overtaking Japan as the world’s top importer of the fuel for a second consecutive month. China imported 7.2 million tonnes of LNG, up nearly 16% from November, while Japan shipped in 6.6 million tonnes, up nearly 7%.
African Swine Flu
- continued to damage Asia and Europe, with mass culling in Indonesia (30,000 hogs dead) and Bulgaria (24,000). Vietnam’s hog population is down over 20% year-on-year as it dropped for the eighth month in a row due to ASF. Ukraine increased its grain exports by 34% to 31.1 million tonnes in the 2019/20 July-June season, helped by higher wheat and corn exports. Besides oil, Brazil exported record monthly volumes of cotton and pork in December, largely on Chinese demand. Between the US-China trade war and good weather, Brazil could yield more soybeans than the US for the first time ever – 121 million tonnes versus 97 million tonnes. The strong US dollar also is favoring the Brazilian farmer. Finally, two prominent US dairy producers have filed for bankruptcy as costs increased and consumers trended away from milk into alternative drinks.
David Burkart, CFA
Coloma Capital Futures®, LLC
www.colomacapllc.com
Special contributor to aiSource