
- Reciprocal Tariffs between the US and China are still on the table but negotiations are under way – it is too early to tell the results. Pressure has been applied by both sides, with China banning/cancelling US soybean purchases in preference for other locations as well as harassment of US military planes from Chinese bases in Africa. Recall from the last commentary that Soybeans represent about 2/3 of all US agricultural exports in value to China (roughly $12.5 billion in 2017). During this negotiation period, the US has started to prepare official WTO action on intellectual property as well as signed into law official US exchanges with Taiwan, treating the island more as independent country than a “renegade province” per official Chinese statements. Right now, the two countries have roughly the same level of tariffs (around 5%, but China is about 1% higher). Historically, the average Chinese tariff was at 15% in 2002 and 30%+ back in the 1990s, while the US has maintained the same level throughout the last thirty years.
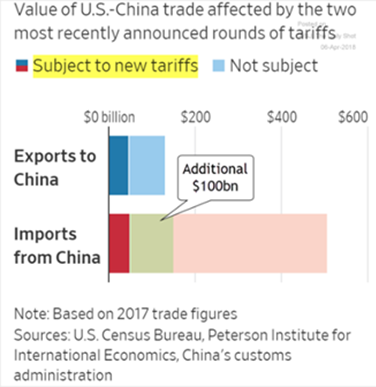
 To recap, China is looking at expanding its tariff list but as the graph to the right illustrates, adding a similar-sized $100 billion to their tariff list against the US would effectively place a tariff on all US exports to China (the light blue section) while the US still has room to add (the area to the right of the green section). With not all the tariffs currently in effect, these negotiations could reverse or expand the situation quickly.
- NAFTA Risk also lingers as those negotiations continue. Canada and Mexico are much more prominent than China in their commodities trade with the US as both countries import from / export to / transship through the US across the energy, grains and livestock sectors. With the upcoming election in Mexico on July 1st and the real possibility of an anti-US leader taking the helm (Andrés Manuel López Obrador), conflict odds are increasing as the negotiations drag out. So far, we think that the markets are discounting these regional risks and over-focusing on the China headlines – but the big takeaway is that US supplies may not have a home.
- Oil Production in the US continued higher to over 10.6 million barrels per day (mbpd), supported by a good rise in the oil-drilling rig count from 797 on March 30th to 825 on April 27th. US crude production rose by 0.26 mbpd with one third of the growth came from offshore production and the rest driven by ‘shale states’, predominantly Texas and New Mexico.
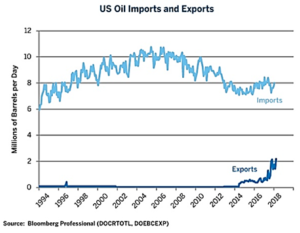 US crude oil exports continued their high pace of 2 mbpd, but there is still a gap with imports running at 8 mbpd (see right), US monthly oil production has surpassed Saudi Arabia’s due to their production cuts and Russia produces about the same as the US despite production cuts (see graph below). OPEC production fell in April on lower West African shipments as well as declines in Venezuela (which have fallen more than the Saudi cuts!). Via the FT, those problems are accelerating as the country has stopped payments to everyone including China and Russia as of a few months ago, breaking grace periods. Venezuela also stopped making payments related to a Canadian-owned gold mine expropriation case (gold production has fallen too from 11 tonnes in 2009 to 0.5 tonnes in 2018). Presidential elections are set for May 20th, but with Maduro set to win amongst candidate and expected voter intimidation and fraud accusations, the results are not likely to be recognized by its neighbors.
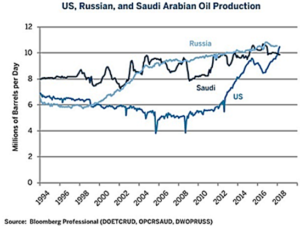

- An Audit of Saudi Arabia’s oil company Aramco as preparation for their IPO has found the state oil giant to have higher reserves than it previously reported (Reuters). The current proven oil reserves are at least 270 billion barrels, which is slightly higher than the 261 billion barrels the company reported in its 2016 annual review. OPEC and Russia are considering ways to extend the oil cuts to maintain prices even though the originally defined surplus has essentially been absorbed by the cuts and increasing demand. Of course, higher prices will encourage more drilling and not just in the US. Brazil’s Petrobras expects oil production to start by the end of June at its Tartaruga Verde e Mestica offshore platform, the second of seven facilities planned to be installed this year. The seven platforms are to add up to 500,000 bpd in new output by the end of 2019. Also, eastern Libya’s leader, General Khalifa Haftar, has returned to his lands after receiving medical treatment in France, which implies that production from that important region may be more stable going forward.
- China Oil imports were the second highest ever in March at 9.2 mbpd and Chinese refineries processed a record of more than 12.1 mbpd. Chinese domestic oil output remained flat at about 3.8 mbpd – the lowest level since June, 2011.
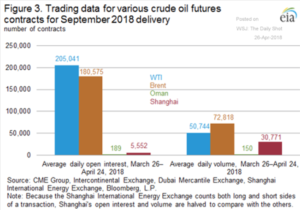 Demand is expected soon to fall temporarily by 1.1 mbpd as the heavy maintenance season begins. China exported a record amount of gasoline and diesel in March, with gasoline at 312,000 bpd (+46% year-on-year) and diesel at 580,000 bpd, up 12 % from a year ago. Not only are the US and China both importing crude oil and exporting products, they are trading with each other; the US completed its first VLCC-sized shipment of crude oil (1.9 million barrels) arriving in Rizhao, China on April 17th. Trading volumes of the new Chinese oil futures contract look good (see graph on the right) but the low open interest indicates that few are willing to commit serious capital so far to the market. Successful deliveries against the contract are needed to build confidence. However, as global exports shift to China away from the US, there is greater need to hedge against Chinese specifications so the numbers should increase. But, as the Shanghai contract is denominated in yuan, Chinese currency controls limit the attractiveness of holding local currency as margin and to transfer significant capital there in the first place. I think that it will take five years or more for a “petro-yuan” market to fully form, especially if currency regulation remains in place.

- Other Energy News included the headline that the UK went for a record 55 hours without using any of its coal-burning plants to generate electricity – wind, natural gas and solar filled the gap with the previous record set in October at 40 hours. In February 2018, for the ninth consecutive month, US dry natural gas production increased year-to-year from the same month a year ago – and exports continued to increase with the US sending LNG to eleven countries. Alternative energy was highlighted in a recent Bloomberg article saying that global electric bus adoption will displace almost 280,000 bpd in crude oil demand by the end of 2018, assuming China continues to add a “London-sized” electric bus fleet every five weeks (9,500 vehicles) as it did in 2017. Because buses consume 30 times more fuel than average sized cars, their impact on energy use so far could be much greater than the growth of electrical passenger cars. Finally, one of the last items of fallout in the changing energy landscape is that Ford announced that cars will be only 10% of its production by 2020 with the rest as trucks, SUVs, crossovers and commercial vehicles. Workforce reductions have not been announced. Better buy that Focus while you can!
- Tug-Of-War in Grains as plentiful supplies weighing on prices were challenged by weather issues and a slow start to the North American planting season. Both Argentina and Brazil have been fighting off drought and poorly timed rainfall while US farmers stated that they will plant less soybeans and corn, pushing harvest forecasts to come in below the levels reached in 2017 (though supplies should remain abundant). Argentina is now allowing US-sourced pork into the country for the first time in 26 years, partially to offset lower domestic meat production from the drought. Argentina’s herd will shrink by up to one million head of cattle next year as ranchers facing scorched pastures after the worst drought in decades decide to slaughter females rather than grow their herds. Meanwhile, Russian wheat exports are up 43% year-on-year so far this season.
David Burkart, CFA
Coloma Capital Futures®, LLC
www.colomacapllc.com
Special contributor to aiSource