
COVID-19 is the 2008 mortgage crisis of the 2020s – if anything, the build-up, impact and reaction are even more rapid and extreme. Therefore, subtle analysis must be set aside in exchange for either short, speedy execution or very long, slow positioning. This month’s editorial will focus on the current state of play in COVID’s impact on the economy, commodities and when and where the green shoots may come into play.
- A Month Later, the confirmed global infected surpassed ten times that at the same time in March (April 7th versus March 11th), with 1.4 million cases worldwide and about one-fourth in the US. With basically no new Chinese cases in a month, their numbers look a bit strained as workers returned to factory floors. In comparison, South Korea had tested less than 1% of their population (350,000 people) with 10,000 total cases, 192 deaths and 6,700 recoveries as of April 6th. The mortality rate worldwide was at 6% and US running at half that level. These percentages will likely continue to decline as testing increases and if Italy and other countries are indeed approaching the apex of the infected. Our thoughts and prayers go out to those taken ill and we hope that they have access to proper care, which seems to improve the odds dramatically.
- Global GDP as indicated by Bloomberg’s forward looking indicators crossed over to the negative mark in March after a strong January and marginal February. The recent past is not relevant. For example, Q1 will therefore probably be flat or slightly positive with the US at +1.3% annualized per the Atlanta Fed. However, Q2 is when the real hit should come but the estimates are very wide as discussed below. One consideration to mention here is
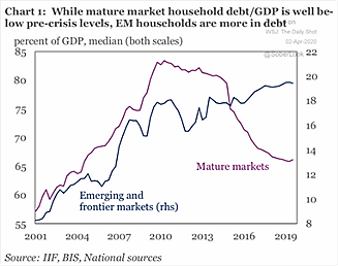 that the IMF and World Bank have warned of emerging market debt default with Sri Lanka, Honduras, Turkey and Tunisia as “particularly vulnerable” while per the FT Zambia and Ecuador told investors that they were struggling to service debts. Overall, “frontier” debt totals $3.2 trillion, about 114% of their annual GDP, an all-time high ratio. Another view can be seen in the graph to the left with regards to EM households. Through this lens, it echoes of the Asian financial crisis in 1998 (remember “contagion”?) or even the Latin American debt crisis in the 1980s. Any country dependent on commodity production is at risk (basically all of Latin/South America, Africa, the Middle East and large portions of Asia).
Commodities: Global
- 2020 Oil Demand fell off the rails as most of the world’s GDP shut down factories and businesses. The graph on
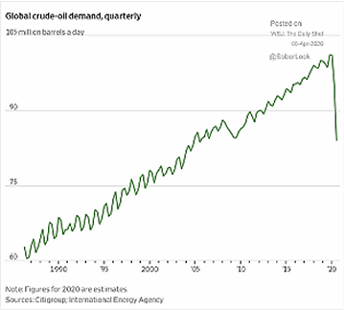 the right estimates a 20% drop in global demand for Q1 2020 – compare the recent cliff to the modest dip in 2008-09. Even if there is a recovery after economic activities are resumed, Capital Economics forecasted a return to only 94 million barrels per day (mbpd) by the end of the year (roughly 2012 demand levels). Pricewise, US crude futures hit $20 per barrel, a price last seen in at the beginning of 2002, almost twenty years ago. With demand collapsing, one has to look at supply for the explanation.
- The March OPEC+ Meeting descended into disarray as Russia refused to lower its production 500,000 bpd further to be in line with a 1.6 mbpd cut proposed by Saudi Arabia and other OPEC members. This move effectively killed the current agreement which expired at the end of March. In reaction to Russia, Saudi Arabia unilaterally announced increased production from 9.7 mbpd to approaching 12.3 mbpd in April, a new record and a level above Russia (at 11.3 mbpd in March). Projected Saudi exports in turn would rise from 7.0 mbpd to over 10 mbpd to a world that did not demand it. The crash in prices and the rapid filling of storage tanks sent the curve into deep contango, reaching the zone of the valuations seen in the 2008-09 crisis. Also like then, oil tankers shifted their role from transportation to storage. Per Morgan Stanley, 25% of the world’s floating storage capacity has been utilized (100 million barrels of a total 400 million barrels). JP Morgan puts global on-shore storage at about 900 million barrels. Taking the 15 mbpd in demand destruction graphed above, that means the world will fill up in two or three months. There will literally be no place to put the crude oil – even ignoring very relevant limitations over geography, logistics and grades. What’s to be done? On April 9th OPEC and Russia will meet with a few additional guests (not the US though) and on the 10th, energy ministers from the G20 will also meet. Some indications pointed to a cut of up to 10 mbpd that with low oil prices cutting US production, the filling would be slowed dramatically by the end of April. We shall see but a crazy Easter weekend for certain.
- Some Cuts Already as Brazil’s Petrobras doubled its oil output cuts to 200,000 bpd or about 6% of total production, and shorten work hours. North Atlantic Refining’s Come-by-Chance refinery in Canada that serves the US northeast will be the first to close in North America due to the coronavirus pandemic. Iran’s crude oil exports to China have dropped further to less than 220,000 barrels per day, generally in repayment for China’s $5 billion investment in Iran’s oil fields. Indian Oil declared “force majeure” against some April oil imports as plunging demand backed up storage tanks. Refinery runs for all of India were projected by Energy Aspects to fall 40% to 3 mbpd in April as demand collapsed. Saudi Arabia announced emergency stimulus measures to support its economy by more than $32 billion via loans and delaying of tax payments. China started buying oil for state reserves after sharp drop in prices. Refineries also started increasing runs as domestic fuel demand began increasing. Finally, Mexico’s famous oil hedge paid off, reportedly covering 2020’s loss from the fall in oil prices.
- US Oil 2020 Production Estimates fell by -9.5% as released by the government’s Energy Information Agency to
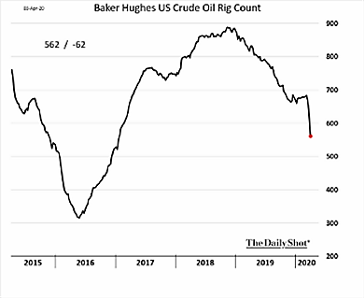 average 11.8 mbpd and 11 mbpd in 2021. Essentially, production move from 13.1 mbpd of crude oil to 12 mbpd in Q2 and 11 mbpd at the end of the year. It could easily be lower as operating drilling rigs held steady, shifting from 678 on February 28th to 624 on March 27th and more rig closures the first week in April to 562 (see the graph to the right). US Energy Department tried to include a crude oil purchase plan for the Strategic Petroleum Reserve (SPR) in the $2.2 trillion COVID stimulus package, but it was blocked. Instead, the government offered up a lease program of up to 30 million barrels of storage space in the SPR in exchange for payment-in-kind. We shall see how needed it is as many US oil producers have already started to cut production with estimates between 25% – 50%. The cuts may happen directly from the disease as Chevron confirmed two US Gulf cases, and the US Coast Guard said that a total of 14 US Gulf offshore workers on five different offshore facilities have tested positive. On the refinery side, a BP Whiting worker tested positive for coronavirus.
- African Swine Flu moved to the back page, but US pork exports to China have remained strong. US meat processing plants have tried to stay open but a few plant closed in early April due to infected staff. Brazilian meat exporters also tried to not cut production and related exports. Live Cattle futures prices haven’t been this low in nearly ten years. In grains, US farmers plan to plant their biggest corn acreage in eight years this spring, based on a survey of 80,000 farmers. They must be confident or are anticipating more government funding as the US coronavirus stimulus bill would add almost $25 billion in funds for US farmers hurt by the pandemic. Meanwhile, weather conditions and soil moisture are favorable for Ukraine’s 2020 spring grain sowing as it is exporting record amounts of wheat, corn and barley – 22% ahead of last year’s pace. Brazil is holding steady it grain exports despite the virus per its exporting association. In short, the glut continues.
David Burkart, CFA
Coloma Capital Futures®, LLC
www.colomacapllc.com
Special contributor to aiSource