
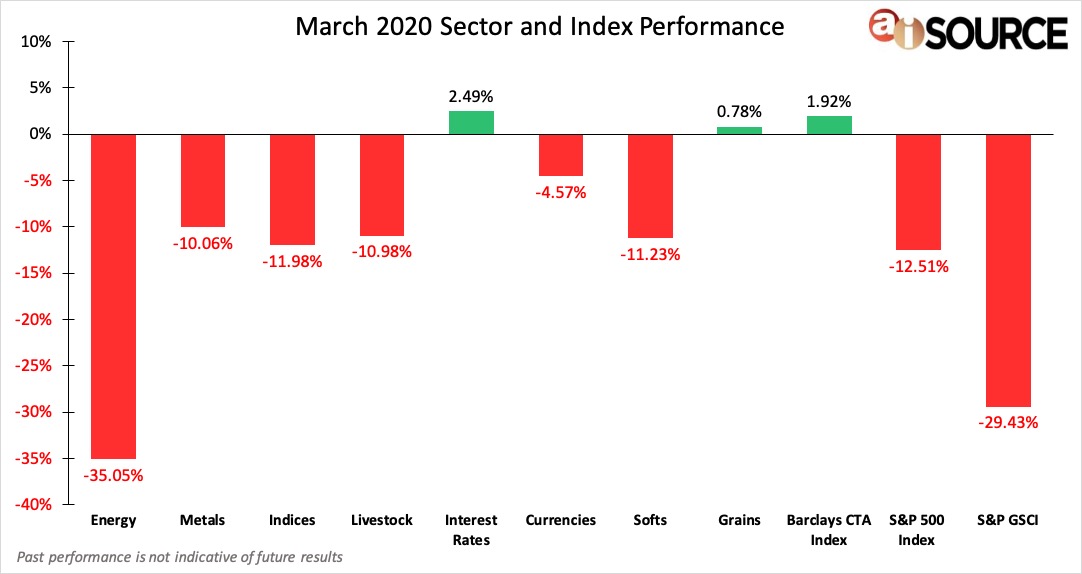
During the month of March, the top 3 performing sectors were: Interest Rates (2.49%), the Barclays CTA Index (1.92%) and Grains (0.78%). The bottom 3 sectors were: Energies (-35.05%), S&P GSCI (-29.43%) and the S&P 500 Index (-12.51%). The month of March was historical to say the least. COVID-19 fears disrupted every market bringing new lows and extreme volatility. Crude oil dropped just below $20 a barrel as energies struggled to gain traction, and equity indicies rapidly sold off all time highs. But with rapid change, comes new opportunity. The federal reserve introduced a $2.2 trillion dollar stimulus package benefiting small businesses hoping to breath life into the markets. Looking ahead to the month of April, investors hope to see a “flattening of the curve” and promising COVID-19 data.
For month to date and year to date CTA rankings, please remember to visit our CTA Database. If you do not have a login and wish to register for free, please click here.
Sector & Index Performance Consists of the following:
Grains: Corn, Soybean Meal, Oats, Soybeans, Soybean Oil, Wheat, Rough Rice. Livestock: Live Cattle, Feeder Cattle, Lean Hogs. Softs: Cocoa, Orange Juice, Sugar No. 11, Random Length Lumber, Coffee, Cotton No. 2. Currencies: Euro Currency, Japanese Yen, British Pound, Canadian Dollar, Swiss Franc, US Dollar, Brazilian Real, Mexican Peso, Australian dollar. Indices: S&P 500, Mini Dow, Mini Nasdaq. Interest Rates: 30-year t-bond, 10-year t-note, 5-year t-note, Eurodollars. Metals: Gold, Silver, Copper, Platinum, Palladium. Energy: Crude Oil, Reformulated Gas, Natural Gas, Heating Oil, Denatured Fuel Ethanol. S&P 500 Index – data collected from investing.com. Barclay CTA Index – data collected from barclayhedge.com. S&P GSCI Index – data collected from us.spindices.com/indices/commodities/sp-gsci.