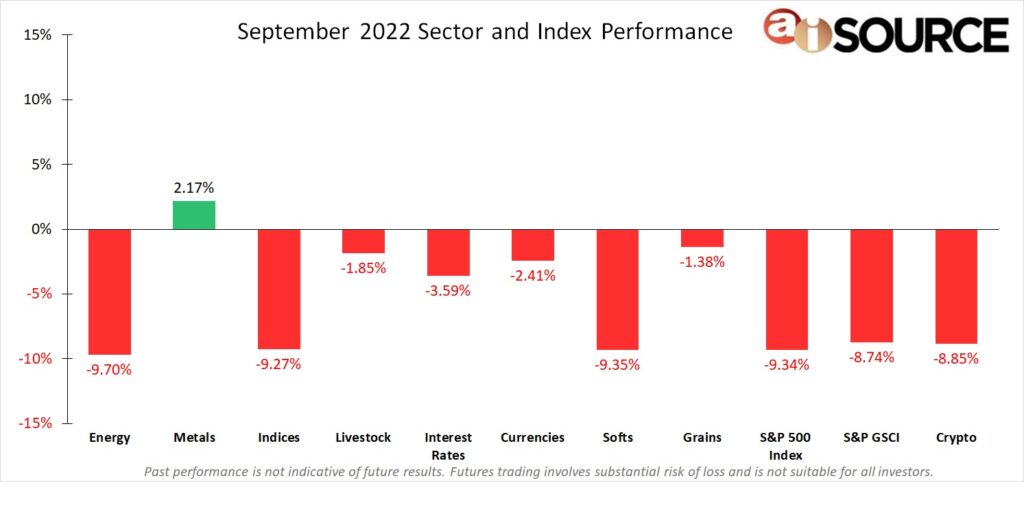
During the month of September, the only positive sector was: Metals (+2.17%), which was mostly contributed by Silver. The bottom 3 sectors were: Energies (-9.70%), Softs (-9.27%) and Grains (-9.35%). The sell off at the end of August continued across most all commodities into much of September. Equities had one of its worst months on the year as the S&P 500 index was down just over -9.0% . The Fed stayed course and raised rates another 75 bps to 3.25% as they stuck to their promise in fighting inflation. The US dollar continues is strength against all other major currencies hovering near 20 year highs. The global pandemic may be over, but the after effects are showing in economies globally.
For month-to-date and year-to-date CTA rankings, please remember to visit our CTA Database. If you do not have a login and wish to register for free, please click here.
Sector & Index Performance Consists of the following:
Grains: Corn, Soybean Meal, Oats, Soybeans, Soybean Oil, Wheat, Rough Rice. Livestock: Live Cattle, Feeder Cattle, Lean Hogs. Softs: Cocoa, Orange Juice, Sugar No. 11, Random Length Lumber, Coffee, Cotton No. 2. Currencies: Euro Currency, Japanese Yen, British Pound, Canadian Dollar, Swiss Franc, US Dollar, Brazilian Real, Mexican Peso, Australian dollar. Indices: S&P 500, Mini Dow, Mini Nasdaq. Interest Rates: 30-year t-bond, 10-year t-note, 5-year t-note, Eurodollars. Metals: Gold, Silver, Copper, Platinum, Palladium. Energy: Crude Oil, Reformulated Gas, Natural Gas, Heating Oil, Denatured Fuel Ethanol. Crypto: Bitcoin and Ethereum. S&P 500 Index – All data collected from investing.com. S&P GSCI Index – data collected from us.spindices.com/indices/commodities/sp-gsci.

