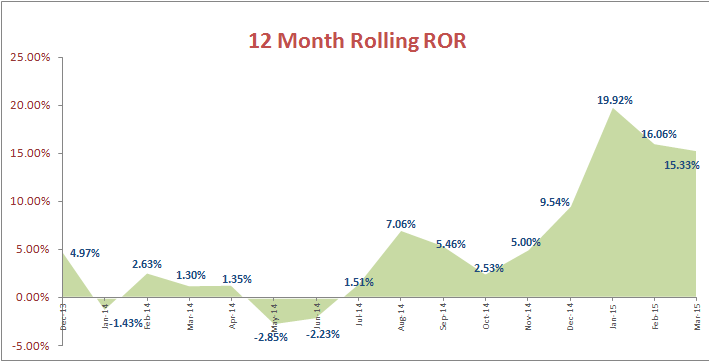
When analyzing a commodity trading advisor’s (CTA) track record, investors generally focus on yearly returns and peak-to-valley drawdowns. It’s natural intuition to look at a table of returns and see if a CTA has been profitable (or unprofitable) on a yearly basis. But, why do we focus so much on calendar returns, when a CTA allows you to invest (and withdraw) at any point during the year? Analyzing a CTA’s 12-month rolling rate of return might paint a different picture:
Here is a sample return stream:
*Past performance is not indicative of future results
At first glance, an investor would notice that the track record is short, but the CTA has managed to have a profitable 2013, 2014, and is currently profitable through 2015. What an investor may fail to realize is that the calendar year returns are technically arbitrary numbers, since a CTA allows an investor to invest at any time during the year. Therefore, it is important to look at the rate of return for every 12-month period in the track record: Jan 2013 through Dec 2013, Feb 2013 through Jan 2014, March 2013 through Feb 2014…etc. In order to calculate how many 12-month periods there are in a track record, add up the total number of months, and subtract that number by eleven. The track record above, which has twenty seven months of data, has sixteen 12-month periods.
We calculated the 12-month return for each period, and plotted the returns on a chart:
While it was not noticeable on the track record, this return stream actually has three negative 12 month periods: the period from Feb 2013 through Jan 2014, the period from June 2013 through May 2014, and the period from July 2013 through June 2014. What the rolling 12-month rate of return chart is showing you is if an investor would have been profitable with a CTA after investing with them for a period of 12 months (based on their historical track record).
Is it possible to find a CTA with a long track record that has no negative 12-month periods? Yes, but there are not that many. What’s more important to take away from a CTA’s rolling 12-month rate of return chart is to compare the number of negative periods to positive periods, and to compare the depth of the negative periods versus the peaks of the positive periods. For example, you will notice the largest 12-month losing period in this track record is -2.85%, which would have occurred if you invested in the strategy from June 2013 through May 2014. This pales in comparison to the largest profitable 12-month period, which occurred from December 2014 to January 2015 and had a profit of 19.92%.
Lastly, more important than focusing on each individual CTA’s rolling 12-month return is to calculate and view the 12-month rolling returns for your entire portfolio. It is inevitable that all CTAs will go through periods of negative or flat returns, however the goal should be to put together a portfolio of CTAs that have a combined historical performance without any negative 12-month periods. The aiSource database portfolio builder allows you to build multi-CTA portfolios, and will automatically generate a rolling 12 month rate of return chart.


