With the Republican National Convention last week, and the Democratic National Convention underway this week, presidential election season has officially started. As the nominees start heavy campaigning for election day on November 10th, we thought it would be interesting to see how Managed Futures as an asset class has performed during the months leading up to the election.
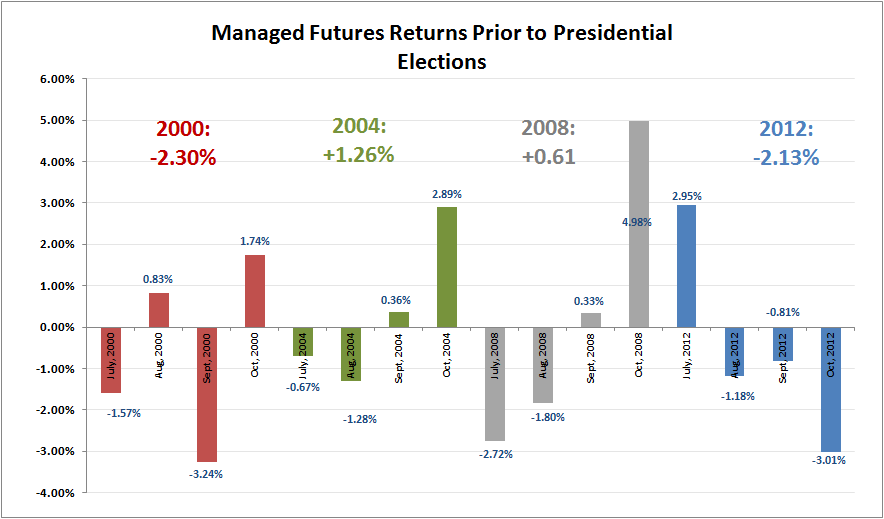
Since Managed Futures assets exploded in the new millennium, we focused our research on the last four elections (starting with 2000). We also concentrated on looking at performance during the four-month period leading up to election day (July through October). Here are the monthly returns during each of the last four elections, along with the total return over the four month period for the same:
*We utilized the SocGen CTA index (formarly the NewEdge CTA index) for our data
As you can see from the chart, the returns are mixed each month, and period over period for each election year. October 2008, which was the start of the financial collapse is the best month on the above chart with managed futures returning +4.98%.
What does the above say about the coming three months leading up to the 2016 election? It’s tough say, as the results are inconclusive. Apessimist would argue that overall the performance across the previous four elections is slightly negative. An optimist would argue that the performance seems to alternate with every election, and since the last election was negative, we may be headed for positive performance in the coming months.

