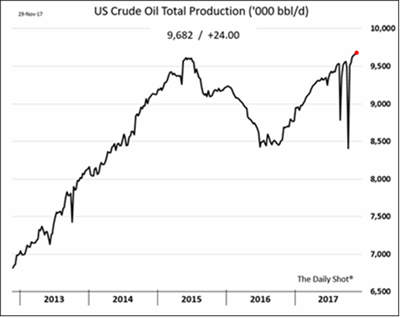
- On Oil in 2018: OPEC and Russia’s suppressed production attracts the headlines, but the western hemisphere is going full bore to take advantage of any price increases. US production motored higher to a new peak of almost 9.7 million barrels per day (mbpd), fully recovering from the season’s damaging hurricanes (see left). Shale oil is expected to deliver 6.2 mbpd of that amount. Looking ahead, expanding non-OPEC production is set to continue. Rystad
 Energy Research indicates that at $35 per barrel, the prolific Permian shale can maintain current production but at higher prices can deliver up to 50% more oil (3.0 mbpd to 4.5 mbpd by the end of 2020 – if prices were at $75 per barrel). A move to $55 per barrel (a price level forecasted by many banks) is expected to push that region’s production higher to 3.5 mbpd. Overall, the US’ Energy Information Agency (EIA) projects total 2018 US production averaging 9.95 mbpd (+0.7 mbpd over 2017) and exceeding 10.0 mbpd in 2018 Q4 (similar to Russia’s current production). With expansion expected in the US, Canada, Brazil and Mexico, the International Energy Agency (IEA) is forecasting an additional +1.4 mbpd on the market by non-OPEC/Russia producers in 2018. OPEC’s number by comparison is a smaller but still substantial +0.9 mbpd. Oil demand is also expected to increase, primarily from emerging market economies. The IEA has that net increase pegged at +1.3 mbpd, essentially matching the non-OPEC increase. OPEC/Russia’s recent reaffirmation of the oil cuts for 2018 with a review in June implies limited further declines of global inventories. However, if the Aramco IPO is successful and the Saudis and Russians turn back to fighting for market share, then all bets are off. Therefore, oil prices look to be stable to lower in the coming twelve months from ready supply.
- The risks to the above can be found on both the supply and demand side of the equation. On the supply side, the Middle East is an obvious concern as Saudi Arabia undergoes a power realignment, the civil war in Yemen next door could draw more direct Saudi and Iranian confrontation and Kurdish independence dreams defy the governments of Syria, Iraq and Turkey to various degrees (and potentially Iran). Key Iraqi pipelines and oil fields in particular hang in the balance, though they currently are under the control of the central Iraqi government. The strife in Libya and
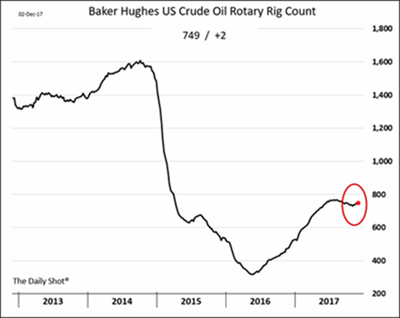
 Nigeria (which may have quotas per the November OPEC meeting, though they are non-binding at current production levels) could also cause uncertainty as their internal conflict fortunes determine output. Venezuela too could throw the markets but their impact is declining daily as production collapses under Maduro. The US rig count tilted up, moving from 737 on October 27th to 749 on December 1st – not a total change in trend but a hint that US production could move up quickly. Drilled but UnCompleted wells (DUCs) hit a high of 7,342 at the end of October, again implying greater US production on any price spike or cash flow issue. With the oil curve in backwardation, these DUCs could be completed quickly and oil delivered against front month contracts if needed. A desperate maneuver but a method to get the highest dollars per barrel in today’s market.
- On the demand side, the core surprise will be if emerging (especially China and India) and developed markets grow faster than expected. The OECD upped its GDP forecasts for Europe and the US as mentioned above is growing well. A Chinese GDP slowdown, while expected due to its large and increasing denominator and slightly tougher credit rules, still puts the country growing at about 6.5%. Oil demand in October 2017 was 9% higher year-on-year to 11.5 mbpd, with similar increases in gasoline, diesel and kerosene. Secular oil demand growth will continue in China in 2018 as the country continues to build out its strategic reserve, though that is included in the EIA projections. Global demand can shift lower but will need some kind of economic event behind it. A slowdown is very possible in 2018 but the world economy is very likely to put in a positive number, keeping demand on track.
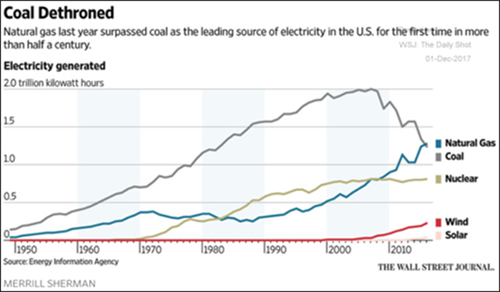
- And Other Commodities News… In one of the more interesting graphs in a while, see this one on the right outlining the change in US electricity generation! The coal collapse and natural gas surge is of no surprise but the uptick in wind continues to impress while nuclear has stayed pretty constant. The USDA said in its monthly supply and demand report that the bumper corn
 harvest will raise stockpiles even as exports and usage from the feed sector rise from its previous estimates. In particular, the government agency increased yields by a whopping 3.6 to an expected 175.4 bushels per acre, making an already large forecast even larger to a record.
- Looking Ahead, Grain prices will have to fight to move higher in 2018 – weather events are the main variable against large supplies. Livestock also has a lot of inventory though the export market should continue to be strong assuming the global economy holds up. Metals prices will depend on China of course – an economic slowdown at the end of 2017 is our primary macro risk factor (see below). Gold also will continue to struggle against a backdrop of (slightly) higher interest rates, though it would benefit from a financial panic (as well as bitcoin and other alternative currencies).
David Burkart, CFA
Coloma Capital Futures®, LLC
www.colomacapllc.com
Special contributor to aiSource
