
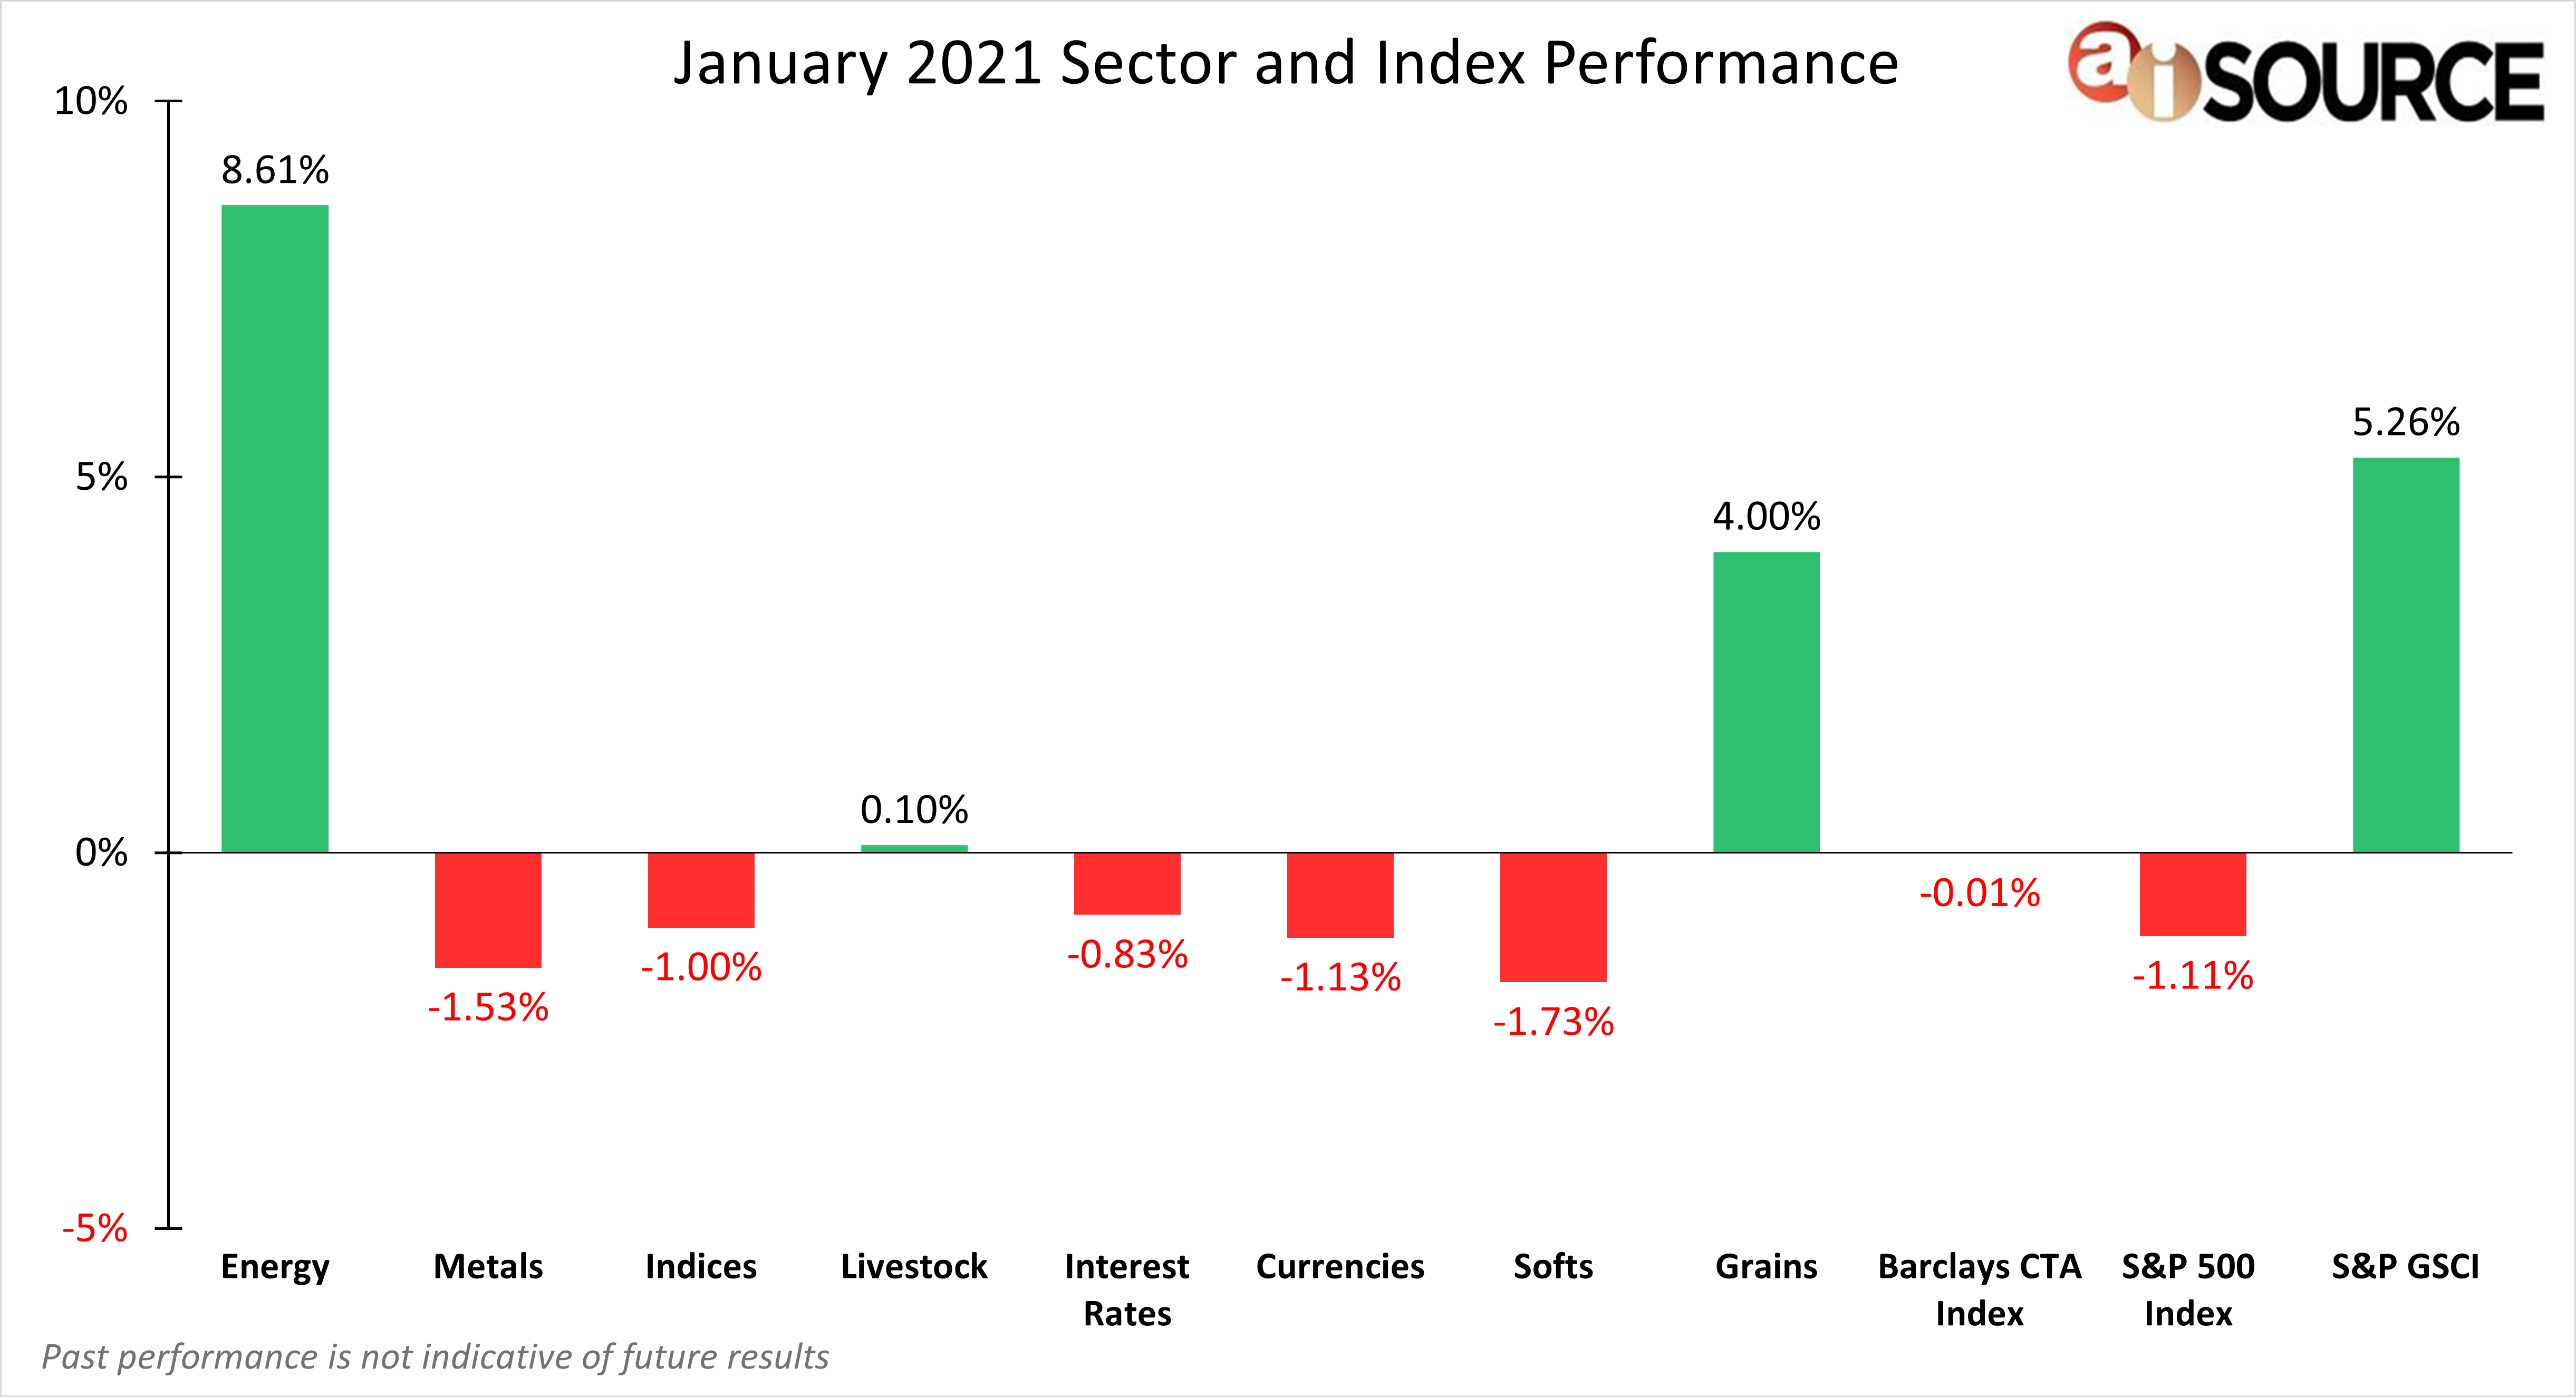
During the month of January, the top 3 performing sectors were: energies (8.61%), grains (4.00%), and the S&P GSCI (5.26%). The bottom 3 sectors were: softs (-1.73%), metals (-1.53%) and currencies (-1.13%). Energies continued to post positive returns as global oil demand increased, healthcare companies ramped up vaccine distribution, and economic stimulus filled consumer’s pockets. Ethanol (14.45%), reformulated gas (11.65%), and heating oil (8.41%) drove most of the market’s returns but many investors stay weary as they think returns may plateau. Looking at the grain market, China purchased its biggest lot of corn yet, making it one of the largest importers of feed in 30 years (Reuters). As a result, the entire grain market posted above average returns as well. Lastly, US equities hit all time highs and the US dollar (0.75%) had a slightly positive January as the United States inaugurated it’s 46 president, Joe Biden.
For month to date and year to date CTA rankings, please remember to visit our CTA Database. If you do not have a login and wish to register for free, please click here.
Sector & Index Performance Consists of the following:
Grains: Corn, Soybean Meal, Oats, Soybeans, Soybean Oil, Wheat, Rough Rice. Livestock: Live Cattle, Feeder Cattle, Lean Hogs. Softs: Cocoa, Orange Juice, Sugar No. 11, Random Length Lumber, Coffee, Cotton No. 2. Currencies: Euro Currency, Japanese Yen, British Pound, Canadian Dollar, Swiss Franc, US Dollar, Brazilian Real, Mexican Peso, Australian dollar. Indices: S&P 500, Mini Dow, Mini Nasdaq. Interest Rates: 30-year t-bond, 10-year t-note, 5-year t-note, Eurodollars. Metals: Gold, Silver, Copper, Platinum, Palladium. Energy: Crude Oil, Reformulated Gas, Natural Gas, Heating Oil, Denatured Fuel Ethanol. S&P 500 Index – data collected from investing.com. Barclay CTA Index – data collected from barclayhedge.com, the calculation of the total return may only a percentage of the reporting CTA’s. S&P GSCI Index – data collected from us.spindices.com/indices/commodities/sp-gsci.