The US Federal Reserve kept rates steady in its January meeting but the poor showing of Q4 2015 GDP sparked off speculation that no more rate hikes are likely in 2016. Poor industrial production numbers, freight volumes and durable goods orders all contributed to the bullish speculation. Meanwhile, Draghi promised more Q€ at the next ECB meeting to make up for his blunder for not being as generous as the market expected the last time in December. “There are no limits to our action” gave the markets hope that there would be an expansion / acceleration of free money. Japan imposed negative rates (i.e., costs) on excess reserves at its banks in an attempt to spur lending (the idea being that banks would decrease the excess by increasing loan availability, spurring economic activity and higher prices). China continued to muddle along as export data looking better than expected but was discovered to be so on a suspiciously large increase of exports to Hong Kong. Their stock market saw a step back from direct government intervention as the Shanghai exchange fell -22.7% in January to reach 2014 levels. In commodities, the March WTI crude oil price hit a recent low on January 20th, reaching $28.35 per barrel after starting the month at $38.17 per barrel. By the end of the month it had recovered to $33.62, but continued in February to gyrate in that range. Oil producers worked hard to talk the market up on planned cutbacks – cutbacks by others and not by themselves. Given that the last time someone (Saudi Arabia) cut for the good of the market and their “reward” was lower market share and revenue, an agreement will be tougher to achieve this time around – and tougher still to hold everyone to it! A lot of animosity and distrust, but that is the world we live in.
What A Difference A Month Makes: After the Fed confidently stated in December that there were more interest rate increases in near future (albeit at a modest pace), a lackluster Q4 2015 GDP growth number of +0.7% turned market expectations the other way around. “No way will Janet and the dovish Fed hike!” quickly became the rally cry as dips were bought and risk put on. A strong US Dollar was blamed for killing exports (cutting -0.5% from the Q4 2015 GDP figure), Durable Goods fell -5.1% in December and -5.0% in January, Pending Home Sales were flat at +0.1% month-on-month, Industrial Production came in at -0.4%, Non-Farm Payrolls were lower than expected (though the Unemployment Rate fell to 4.9% and compensation increased) and Household Purchases were up at a +2.2% annualized pace (down from +3.0% the previous quarter). .png?sfvrsn=0&MaxWidth=400&MaxHeight=400&ScaleUp=false&Quality=High&Method=ResizeFitToAreaArguments&Signature=CEE2E121EBE165D0B542C0E56B006AE7) In fact, the stronger dollar and weak global growth have subtracted about 2.5% over the last five quarters – see graph to the right and in the red box. There is no Fed meeting in February but Dr. Yellen testifies to Congress later this month, which will be the next official indication of her thinking about the economy. Meanwhile, the US Social Security Disability Insurance trust fund is on track to run out of assets by October 2016. If this occurs, then monthly income into the program would only be able to provide about 80% of promised benefits to plan participants, according to the Secretary of the Treasury. Note that this is the same rough situation if/when Social Security retirement benefit payments will also drain its trust fund (currently projected in 2033). Will Congress and the President come to an agreement on how to shore up its funding? In an election year? Seems tricky.
In fact, the stronger dollar and weak global growth have subtracted about 2.5% over the last five quarters – see graph to the right and in the red box. There is no Fed meeting in February but Dr. Yellen testifies to Congress later this month, which will be the next official indication of her thinking about the economy. Meanwhile, the US Social Security Disability Insurance trust fund is on track to run out of assets by October 2016. If this occurs, then monthly income into the program would only be able to provide about 80% of promised benefits to plan participants, according to the Secretary of the Treasury. Note that this is the same rough situation if/when Social Security retirement benefit payments will also drain its trust fund (currently projected in 2033). Will Congress and the President come to an agreement on how to shore up its funding? In an election year? Seems tricky.
Same with the restructuring of Puerto Rico’s debt – the latest proposal by its government would be to pay 54¢ on the dollar on average with losses of 28% on the senior general obligation bonds, 51% losses on the sales tax bonds and 61% losses on the remaining agency bonds. Part of the deal would be to issue “growth bonds” which pay out based on local GDP growth (assuming the current economy is turned around, of course). The concept is eventual full principal repayment but offering below-market interest (which, given today’s rates, must be pretty low indeed!). The power utility is negotiating separately a 15% haircut on its debt but the latest offer was rejected and those $8.2 billion in bonds are still in limbo. Meanwhile Argentina has resumed talks with its creditors after receiving $5 billion in bridge loans from global banks, and Venezuela has started to miss required oil payments to China under its bilateral debt provisions. It looks like a lot of negotiation as we head into spring!
“No Surrender”: Draghi adamantly stated at the latest meeting in that the ECB would do whatever it takes to accelerate its monetary expansion as soon as the March meeting, spurring a broad market rally and sending European bonds further into negative territory. After disappointing everyone at the December meeting, Draghi appears to think that more Q€ is just the ticket to spur the economy. 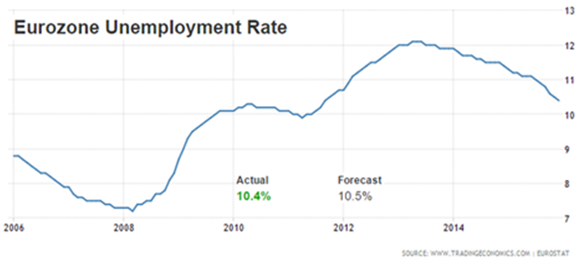 GDP growth may still be tepid (IMF has the 2016 projection at +1.7%) but it seems that he is focusing less on the improving employment situation (see graph at right) and more on the continuing banking situation. Spanish unemployment hit a five-year low in December – though still at 20.9%. Germany hit 6.2% unemployment, the lowest since reunification in 1990. Across the channel, the UK reached 5.1%, a level last seen before the crisis.
All is not well however, as Greece descended into general strikes against austerity as the troika and the Greek government are due to meet (again!) over the €84 billion bailout agreed to in July last year. Pension cuts of about 15% (totaling €1.8 billion in savings) are supposedly required to receive new money to bridge the country over to ever-elusive recovery. Meanwhile, the Greek economy is expected to fall -0.7% in 2016 per the IMF. In addition, as a main transit location for migrants, additional costs should be budgeted for. Meanwhile, Italian banks came under more intense scrutiny as non-performing loans have reached €201 billion (about 17% of all loans). A new plan to securitize bad debt or using a “bad bank” scheme funded by the Italian government came under fire as not really solving the issue. Under this proposal, banks would have to sell their loans at market rates, crystalizing losses (but freeing up reserves). More information has been requested by the ECB so the fear of higher capital requirements further diluting shareholders is also a concern. Spain’s Banco Populare is looking to sell €8 billion in non-performing loans and real estate – its non-performing loan portfolio is 13.1% of its loan book. S&P surprisingly lowered Poland’s credit rating from A- to BBB+ on concern that politics are going to interfere with its economy, one of the best performing in Europe recently. A shot-across-the-bow to the new populist right-wing government? We shall see. UK Manufacturing Production fell -1.2% in December versus the -0.8% forecast. On the jobs front, British Petroleum announced plans to cut 5% of its 80,000 strong workforce to combat the effect of low oil prices, and Ford Europe is looking to cut and downgrade/outsource “hundreds” of its 10,300 positions to save $200 million a year. Finally, German Industrial Orders fell by -0.7% for December, sharply down from the +1.5% increase in November and below predictions of a -0.5% decline.
Meanwhile, Russia is feeling the squeeze from low oil prices, with the budget now being slashed by 10% (the equivalent of $9 billion) to cope with the lower revenue expectations. Demographics are playing their part too, with the “economically active” portion of the population set to fall by one million in 2016 and 2017 and the pensioners’ ranks set to expand by 400,000 annually. It will be difficult to support social programs already in deficit on a declining tax base (a lesson for governments everywhere)! Throw on inflation of 16%, and a middle class existence is tenuous indeed. With pensions, salaries and the military held sacrosanct, it seems that the sovereign wealth fund will again be relied upon. 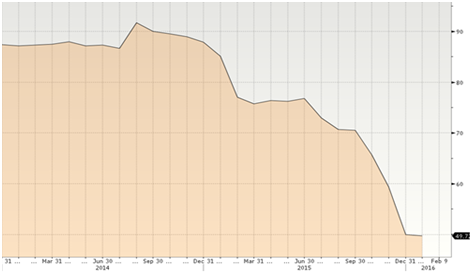 That is, as long as Russia still has one – the graph to the left illustrates the collapse of their reserves from $90 billion to under $50 billion in the last two years, some of which is already allocated and cannot be used to meet budget obligations. Recent calls for limited privatizations of state assets are possible but anyone who is foolish enough to invest should kiss that money good-bye.
No Relief in Sight: The second and third largest economies continue to wobble. China’s 2015 GDP growth came in at +6.9% after Q4 was up +6.8% annualized officially and the 2016 target was set at +6.5% (IMF is projecting +6.3%). December indicators had lower than expected gains, with Industrial Production at +5.9% y-o-y, Retail Sales +11.1% y-o-y and Fixed Asset Investment at +10.0% y-o-y (the FT graph to the right shows the lockstep slow down over the last three years). 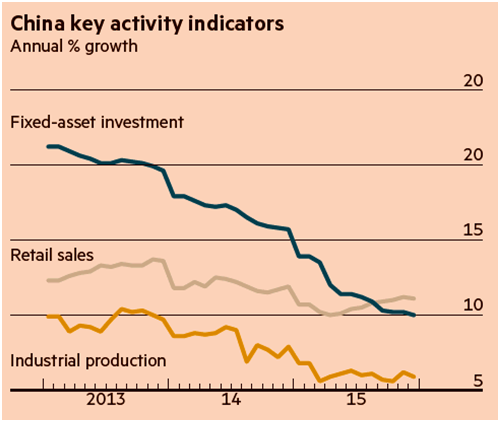 Steel production in particular led the way last month with the first decline in 35 years. Half of the Chinese big producers lost money in 2015, and collectively the steel industry lost $9.8 billion. PMIs, a measure of industrial expansion if above 50 and contraction if below, came in at 49.4 for January, a decline from 49.7 in December. Weaker trade is projected in 2016 with imports falling by -7.6% and exports by only -1.4% in December (though the export number was blatantly contrived as shipments to Hong Kong increased by 10% – recall that overstating export invoices to HK is one way to get funds out of the country illegally). While oil imports surged on low prices (+9.3% in December), coal imports fell, down -30% over the course of 2015. At least home prices continued to move up, with the major city index up +7.7% in 2015.
Japan also had falling exports and imports, with exports down -4.4%, falling for the sixth month in a row. For the year, exports overall were down -8.0% and exports to China were down -8.6%. Exports to the US were down -6.3%. Imports comparatively were down 8.7%, mitigated partially as the majority of the negative number came from lower oil prices. Japan’s crude oil imports for 2015 were 3.4 million bpd (barrels per day), -2.3% lower than the previous year and the lowest level since 1988. The big news from Japan was BOJ’s Kuroda’s announcement that the bank lowered short-term rates to -0.1% and to submit excess reserves at banks to the same negative rate (noting that bank required reserves earn +0.1%). While only a small percentage of bank reserves will currently be charged, it is projected to grow rapidly to 15% of reserves by the end of 2017. While helpful to the government’s interest costs on new issuance, the benefits seem elusive given the chronic deficits that will need to be financed – who will want to buy these negative bonds when there are perfectly nice US Treasury bonds with positive yields?
The rest of Asia also is stumbling along – Singapore’s Industrial Production missed market expectations (-7.9% y-o-y versus -7.0%), Taiwan’s Export Orders also fell more than forecast (-12.3% y-o-y versus -8.0% – particularly on weakness in semiconductors) and India’s Industrial Production fell -3.2% y-o-y versus gains expected of +2.3%. No winners in emerging Asia either.
Commodities Carnage Continues: The winners were decidedly on the consumer rather than the producer side as oil touched $28.35 per barrel, though ended the month above that level at $33.62. Russia, Iran and Venezuela regularly made calls for producer cuts, but that requires buy-in by Saudi Arabia, Iraq and Kuwait who do not necessarily share the same political goals (though the same financial ones). The risk of cheating is too high I think for the Sunni powers to find common ground with the other members, without further economic torture. At some point, yes, their budgets will force a change in policy, but I suspect that it is too soon. Iran insists that it should be allowed to return to its pre-sanction levels of 3.4 million bpd (barrels per day), which basically takes into account the announced +0.5 million bpd increase to December’s production of 2.7 million bpd. However the country is looking for further production gains and has already increased exports by over +20% in January with the sanction relief. OPEC production hit a record in January at 31.9 million bpd with increases by Iran, Kuwait and Nigeria of just under +0.3 million bpd. Russia also is hitting production records with total oil and condensate production of 10.9 million bpd in January – the sixth monthly record in a row. Iraq was not outdone either, hitting a record 4.1 million bpd in production. Kuwait announced planned production increases of +0.5 million bpd at their joint field with Saudi Arabia. The US too is in the game as the first tankers have left its ports with over 6.7 million barrels heading to Europe, Latin America and China. The Chinese oil purchase was the first ever for the US, with the light, sweet quality an ideal blending agent for the heavy Venezuelan that it receives under its debt agreements (assuming the Venezuelans are paying on that debt). Recall that China purchased a blending/storage facility in the Caribbean last year at St. Croix to manage these types of logistics. US gasoline exports also hit a record at 445,000 bpd in November 2015, 50% higher than a year ago – and including a shipment to the Middle East and 70,000 bpd to Asia (the highest figure since the start of records in 2004). We shall see if that sparks a turnaround from the lowest gasoline prices in seven years.
A quick word on the affects from the low oil prices – as the graph on the right shows, production costs (per Capital Research) show that Russia, Canada and US are under stress in the long run – assuming a normal rate of return. 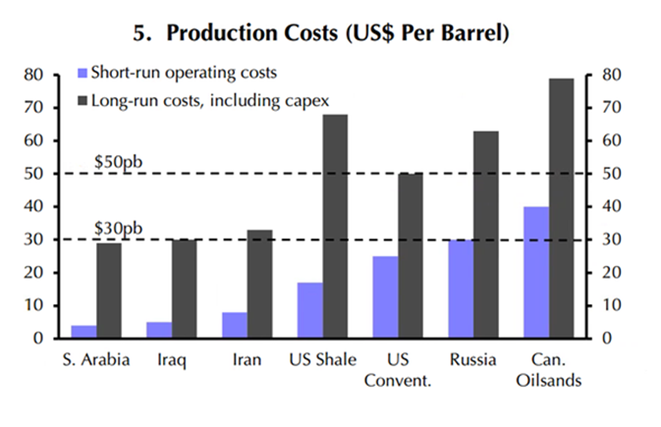 While a relatively extreme 2016 scenario could have the price get back to $50 per barrel, getting to the more lofty numbers will be a challenge. Petrobras I would put at or higher than Canadian oil sands so Brazil will continue to suffer as well. The US conventional (e.g., Gulf of Mexico) will continue to have output expansion as those operations enjoy much slower decline rates and less elastic investment cycles. Besides low costs, Iran had $100 billion unfrozen with the end of sanctions. A lot of that money will probably be spent over the next year or two as Iran clears its books. Per the FT, $7 billion will be brought in for infrastructure projects, $38 billion in strategic foreign reserves for its central bank, $15 billion is owed to pensioners, $22 billion owed to other banks with the leftover for Iran’s sovereign wealth fund and other debts, corruption, etc. In short, the money will lift the economy but its effects will likely fade over the next year or so. Kazakhstan has been depleting its sovereign wealth fund as it spends its $64 billion hoard. In Q3 2015 alone, it spent $19 billion with a projection of another $29 billion over the next three years. The numbers do not add up so one should expect a faster depletion. With one-third of the assets run by global investment companies, there could be more pressure on equity and bond markets from this source. Meanwhile, Nigeria is looking to issue more bonds and has asked the World Bank for a $2.5 billion loan to help it deal with a $15 billion deficit caused by the churning oil markets. Not a good sign from Africa’s largest oil producer.
Other commodities are suffering from similar woes. Coal in the US continued its pariah status as Obama froze the issuance of new coal-mining rights on government land (covering about 40% of US coal production). Existing leases would last up to twenty more years at the current rate of production but longer if that mining continues to slow. Not the end, but perhaps the beginning of the end. 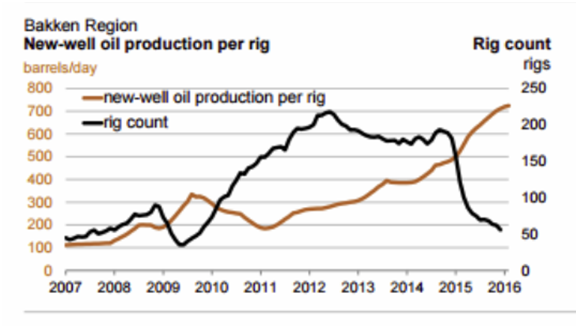 Mining companies continue to sell off assets – Freeport-McMoRan, the world’s largest copper producer is looking to raise between $5 and $10 billion of funds to cut debt from its relatively high debt levels versus other firms. Rival BHP Billiton is to write down its oil/gas shale assets by $7.2 billion. These shale assets will continue to fight the tape with production per rigs still rising and maintaining production despite the declining rig count. It is a good time to buy equipment if you need it! In other words, the producer pain is still coming.
In agricultural news, high grain inventories are keeping the lid on prices, though the El Niño weather effect pouring water on the Western US often has a correspondingly dry Midwest effect so we shall see this summer if there is a price scare. US farmers planted the smallest number of acres of winter wheat since 2010 and hard red winter wheat plantings were the lowest in thirty years. 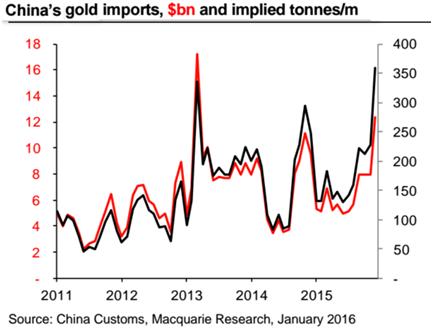 What will corn and soy do come spring is the question. There is speculation that some acreage will shift to cotton or other crops. In South America, Brazil projected that the new coffee crop will be between 49 and 52 million bags, a potential record over 2010’s 51 million bag crop. This is a potential 20% increase over last year as an off-fertility year and after two years of drought. Fortunately for us coffee drinkers, the bulk of the gain will be in the more desirable Arabica beans. However, I would not expect Starbucks to lower prices – that would be asking for too much! Meanwhile in livestock, it seems that the rapid reaction to bird flu this winter has contained the damage to the US poultry flocks versus 2015. While turkeys have suffered somewhat, chickens have avoided the worst of the infections. If this holds, then egg prices particularly should remain stable. Finally, China has resumed its gold purchases with a surge to the highest level in two years in December 2015, 111.3 metric tons. Net buying in 2015 was 774 metric tons versus 751 a year earlier but still lower than the 1,109 from 2013. With the turnaround in gold prices the last few months, and the accelerated desire to diversify investments, we may see another wave of gold buying in the near future.
David Burkart, CFA
February 9, 2016
Coloma Capital Futures®, LLC
www.colomacapllc.com
Special contributor to aiSource
Additional information sources: BAML, BBC, Bloomberg, Deutsche Bank, Financial Times, The Guardian, JP Morgan, PVM, Reuters, South Bay Research, Wall Street Journal and Zerohedge.
