Ukraine: Winter & Sanctions Impact
The Ukraine-Russia Conflict had few headlines. The brutal winter slog continued around the city of Bakhmut and the eastern front. More tanks were delivered to Ukraine but when and where they will be used remained speculative. Russia also would want to fully gauge the follow-through on its recent sessions with China and what kinds of material it receives (note that all imports are effectively war materials, even if to keep civilians happy). Remember that Russia has to spend that oil and gas export revenue on something and importing Chinese military goods make a lot of sense. For now, until the weather clears up after the rains, the war remains one of raw, unrelenting punishment.
Meanwhile, the Grain Export Deal allowing the safe shipping of Ukrainian grain was renewed in mid-March for at least 60 days – half the headline period – after Russia warned any further extension beyond mid-May would depend on the removal of some Western sanctions. Also of note is the pullout from Russia of most of the western-affiliated grain brokers with Cargill and Louis Dreyfus confirming their exit and Olam and ADM expected. Russian entities will take over the assets. Besides China buying Russian oil, Japan had been purchasing Russian crude oil above the $60-a-barrel cap, using an exception authorized by the United States, which was granted through September. In the first two months of this year, Japan bought around 748 million barrels of Russian oil for approximately $70 a barrel. Note that Europe is still buying Russian natural gas after the oil sanctions went into effect in December last year. This was estimated to take energy imports from Russia from almost €140 billion during the war’s first year in 2022 down to a projected 2023 level of €29 billion, depending on the price and volume assumptions of the imported natural gas. 2022 was abnormally high with the initial cold and low inventories driving up costs (for comparison, the EU paid Russia in 2019 €112 billion for fossil fuels; in 2020, €68 billion; and in 2021, €123 billion).
Macro: Asia
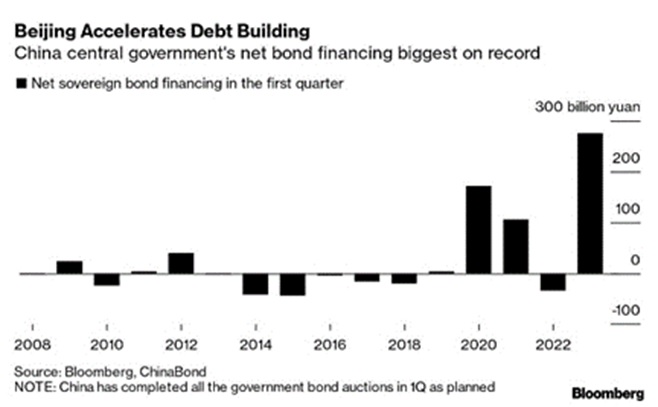
China Reopening Picking Up Speed as China’s oil refinery throughput this year is forecast to rise +7.8%, reversing last year’s decline as the world’s second-largest oil consumer is set for a recovery in fuel demand. Refinery throughput is estimated to reach 14.6 million barrels per day (mbpd), for 2023. Debt spending accelerated also as the central government issued about $40 billion in Q1. The central bank cut the required reserve ratio by 0.25% to spur lending – ten years ago it was 20% for major banks and now it is approaching 10%. That means that one yuan in equity can now support ten yuan in loans, a doubling from five yuan of credit capacity ten years ago. Another way to think about it is that the PBOC has delivered 14 RRR cuts since 2018, lowering the weighted average ratio for banks to under 8% from nearly 15% and or more than 11 trillion yuan ($1.6 trillion), about 10% of GDP from this one mechanism alone. Growing leverage in the Chinese system seems to be a constantly ignored concern.
China Released Economic Data for January-February (both months are generally reported together due to distortions around the New Year holiday), pointing to plodding growth as opposed to a sharp rebound. Industrial production missed at +2.4% y/y (versus consensus  +2.6%). Retail sales were up only +3.5% y/y, compared to the typical pre-COVID pace of near +8%. Fixed asset investment growth accelerated to +5.5%, above consensus but slower than the pace in the first two months last year. Exports in January-February were -6.8% versus a year before, after a -9.9% annual fall seen in December. The result was, however, better than the average expectation in a Reuters poll for a fall of -9.4%. Imports were -10.2% weaker, a worse result than in December, when they were -7.5% lower than a year earlier. They greatly missed the estimate for a -5.5% drop.
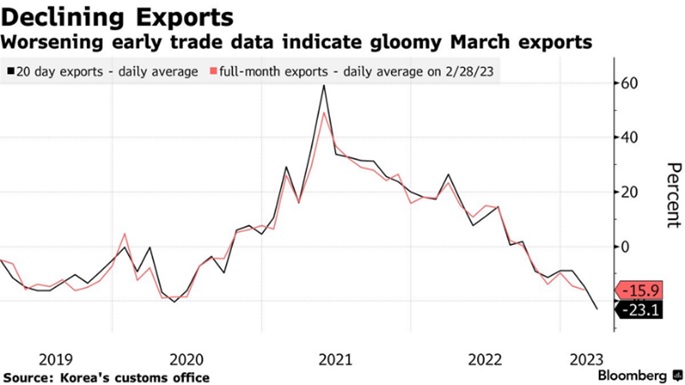
South Korea’s early trade data showed a deepening slump in exports as global demand for semiconductors remains weak. Daily shipments decreased -23% on average in the first 20 days of March from a year earlier (see right). While total exports fell -17%, chip sales plummeted -45% and shipments to China tumbled -36%. The housing market is also faltering, with declining home prices and increasing household-debt-to GDP, hitting 157%, the highest in the 60 countries tracked by the IIF. South Korea’s Financial Services Commission (FSC), said it was considering having its banks hold more capital to prepare for instability as global bank failures and stress hit markets in mid-March. This “Asian Tiger” may be turning tail.
Macro: US
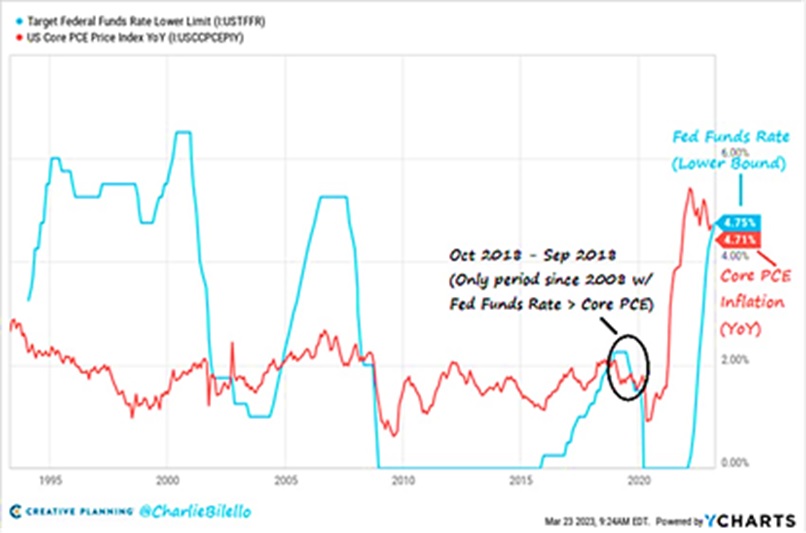
Powell Kept Markets Hopeful despite repeated messages of continual interest rate hikes, though at a minimal +0.25% pace. No change to the balance sheet runoff policy (AKA “Quantitative Tightening”) though the mortgage portion had not paid down as quickly as expected as refinances slowed due to higher interest rates. With the markets expecting a rapid decline in interest rates later this year, the March meeting’s hike of 0.25% was basically ignored. The bigger question is whether the Fed will increase rates at the May 2-3rd meeting or halt its trajectory. A rise in May seems like a “surprise” event even though Powell has indicated such an increase. Can the markets make Powell bend to their will? Or will the crossover between rates (the blue line) and core PCE inflation (the red line – ostensively the Fed’s preferred inflation measure) naturally guide rates lower (see right)? Or will core PCE inflation tick up higher, destroying that narrative?
US Inflation Increased in February by +0.4% to an overall rate of +6.0% for the trailing twelve months with the core rate up by +0.5% and +5.5%, respectively. This is a  decline in the annual rates but the market was hoping for even slower. US average hourly wages were up +0.3% for March with the annualized rate at +4.2%, still lower than expected monthly inflation. Output at US factories increased unexpectedly in February for a second month (fractionally at +0.1%, with January revised up to +1.3%) but consumer data showed cracks: retail sales fell -0.4% for the month and durable goods orders likewise declined. Meanwhile, South Bay Research expects layoffs to hit 2 million this cycle with only about 150,000 announced so far (mostly tech).
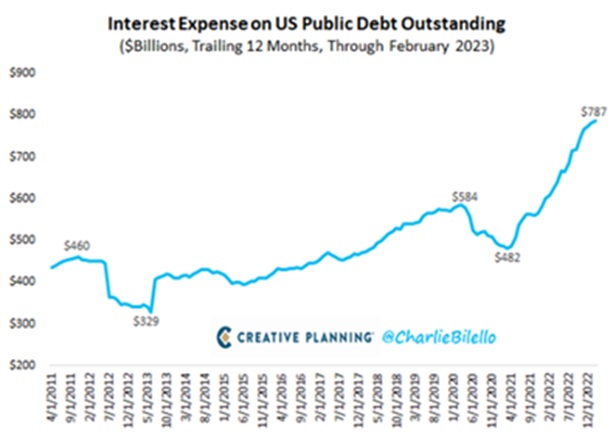
The Ignored Risk? US Budget continued to widen, hitting an 11-month high of $1.6 trillion in February (year-on-year change). Over the last 20 years, government spending has increased at a rate of +5.3% per year, double the rate of inflation over the same time period (+2.5% per year). This trend showed little change as interest paid on the federal debt was $787 billion over the trailing twelve months ending February (see graph on previous page). Furthermore, the amount of cash sitting in the US Treasury’s account at the Fed fell to its lowest level in more than 15 months as the government edges closer to exhausting the measures it has been using to avoid hitting the debt ceiling. Washington DC cannot avoid spending more: the three primary trust funds will be insolvent in the next decade, with CBO projecting that the Social Security trust fund exhausted in 2032, the Medicare trust fund exhausted in 2033, and the Highway Trust run out of money in 2028. The real “summer of rage” will be indoors as one side of Washington DC fights to increase spending while the other tries to rein it in. Expect volatility.
Macro: Europe
Eurozone Inflation moved sharply lower in March to +6.9% annualized from +8.5% annualized in February. However, core inflation (ex-food and energy) ticked higher from +5.6% to +5.7% annualized. Slower growth in energy costs helped but higher prices for food caught markets by surprise (+15.4% in March versus +15.0% in February). The European Central Bank increased interest rates by a half-point at their March 16th meeting despite the banking crisis in Switzerland. The UK inflation rate surprised to the upside, reaching +10.4% in February. Europe may have dodged a bullet this past winter, but energy risks have not diminished for their economies or societies.
David Burkart, CFA
Coloma Capital Futures®, LLC
www.colomacapllc.com
Special contributor to aiSource
