
Macro: Americas
- US Economy is moving forward at a modest pace, with the Q4 2017 estimate increased slightly from +2.5% to +2.9% (annualized) at the most recent update largely on better than forecasted consumer spending but with small contributions across many areas. On the other hand, the Atlanta Federal Reserve is now projecting +2.3% annualized growth for Q1
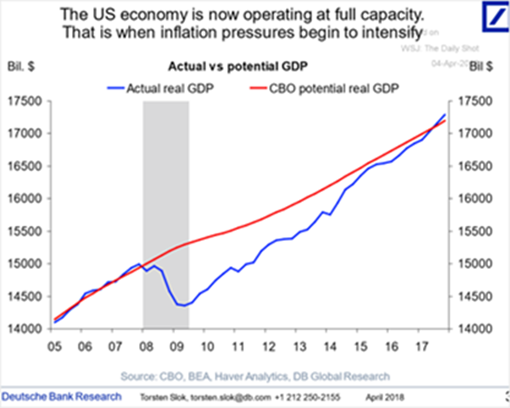 2018 – not bad but not as good as expected or first forecasted. Looking at an estimate of “full economic capacity” or when goods and services are produced most efficient capacity, the US is running at a level where inflation potential is coming into play (per left). Inflation is still missing in action, but from a capacity estimate perspective, there is possible
  pressure. From an employment viewpoint, US payrolls increased in March by a less-than-expected 103,000 but the Q1 average of 202,000 is outpacing the 2017 average of 182,000. Colder-than-usual weather in March may have dampened the latest numbers but the unemployment rate stayed the same at 4.1% with the broader under-employment rate ticking back to the lows of last year at 8.0% from 8.2%. Retail sales fell against expectations largely due to poor automobile sales but ex-auto, it rose +0.2% versus +0.4% expected. Factory orders increased a solid +1.2% in February, and there were similar gains in ex-defense, ex-airplanes capital goods. Factory output also increased by +1.2%. On a year-over-year basis, the total industrial production rose by most since 2011 (just under 5%). The important note is that from an output perspective, the level is moving to the pre-crash highs though manufacturing employment is not showing the same gains at all (see graph at right). The efficiency gains (unsurprisingly) fueled the concerns and discontent that have shown up in American politics.
- Three Rate Increases are still projected by the Federal Reserve with one done at the March meeting just past. The reduction in balance sheet (QT) is happening on pace. The only surprise was an uptick in the expectations for slightly higher rates in 2019 and 2020. Inflation may turn higher, but hard to see right now unless wages
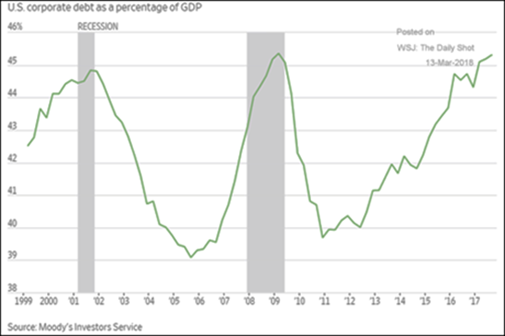 and/or velocity of money turn higher – which we are not seeing yet. Higher deficits are projected in 2018 and 2019 which should be inflationary or at least “crowd out” cheap corporate and consumer debt. However, the Fed is projecting unemployment to drop to the mid-3s, which is extremely low and hard to take seriously, at least from an investment perspective. With regards to consumer debt, there are some worrying signs – US consumers’ overdue credit card debt is the highest in seven years and shaky mortgage debt also moved up. US corporate debt as a percent of GDP hit levels associated with extreme (overdone) economic activity (see left) so another cautionary sign. The percent of high yield corporate bonds with the weakest covenants (AKA the worst protections for investors and banks) reached a dominant 65% of issuance amount – little recourse should be expected in a recession. Tread carefully.
Macro: Europe
- Eurozone Unemployment neared ten-year low in February, hitting 8.5% while the ECB has backed away from continuing its bond-buying in 2019. Currently, the monthly Q€ figure is €30 billion until September and then the thought is to drop that to €10 billion per month until the end of the year. As eligible government b
 onds (basically those that have positive interest rates) have all-but disappeared from the market, the percentage of corporate bonds has jumped from about 8% of purchases in 2017 to 18% in the first two months of 2018 – there is no private market as ECB is the market! The very definition of “crowding out.” The graph to the right illustrates the shift to ECB purchases overwhelming government issuance.
- Russian Maneuvers in Syria and the Ukraine have led to renewed and increased sanctions by Europe and the US but the more interesting development right before Putin’s surprise (ha, ha) election was their issuance of $4 billion in bonds with an unusual provision. While the denomination of the bond is in US dollars, Russia has the option to pay interest and principal in not just euros, sterling and Swiss francs, but also rubles. Yes, if the economy collapses, the government can just print off a bunch of rubles and force the bondholders to take them. Why anyone would want to buy these bonds is beyond me as they can pay them back in the least advantageous currency for the investor, easily wiping out the interest or causing a capital loss.
Macro: Asia
- China’s Economy keeps roaring along in the official numbers with industrial up +7.2% v s+6.2% expected year-on-year with fixed asset investment beating forecasts at +7.9% vs +7.0% and retail sales matching expectations +9.7% vs +9.8%. Relative GDP is to reach a milestone this year with China’s economy set to overtake the EU (see graph to the right). China home sales growth slowed in the first two months of this year, amid an almost two-year government campaign to cool the pro
 pe
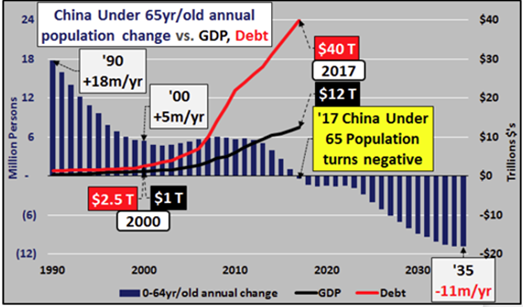
pe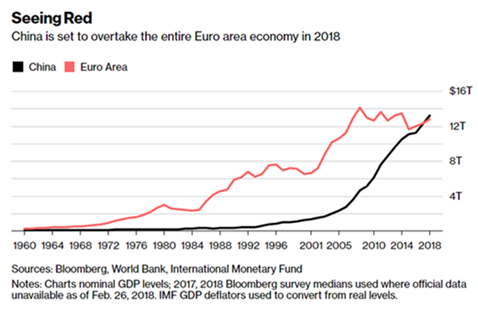 rty market. Sales by value, excluding state-subsidized affordable housing, rose 16% from a year earlier to 1.06 trillion yuan ($168 billion) in the January-February period (combined to smooth the effects of the Lunar New Year holiday), according to Bloomberg calculations based on official data released Wednesday. That’s down from a 21% pace in December. The China demographic risk is summed up in the following chart – 3.4x total country debt versus GDP and a declining population under 65 years old going forward. How will these workers pay for all this debt-driven growth? Anbang Insurance Group went effectively bankrupt with $123 billion in assets in February and the government took over daily operations. In March, the China Insurance Security Fund injected $10 billion in new capital to keep the firm going. Will this be the first or the last bailout?
- Japanese Industrial Projection grew +1.4% year-on-year but missed expectations of +2.3%. More quietly but more importantly, the seventh Japanese nuclear reactor restarted after the Fukushima earthquake with regular operation to be in place in April. Nuclear power is about 2% of the mix versus 30% back in 2011 and has to be 20-22% to meet CO2 emission levels per the Paris climate accords. 43 reactors remain off-line and 21 restart applications are in place though only 12 are estimated to come back by 2025 (18 by 2030). Other low-carbon sources are expected to continue to grow from 9% to 22-24% by 2030 to fill in the gap.
David Burkart, CFA
Coloma Capital Futures®, LLC
www.colomacapllc.com
Special contributor to aiSource
Additional information sources: BBC, Bloomberg, Economica, Financial Times, JP Morgan, PVM, Reuters, South Bay Research, Wall Street Journal and Zerohedge.