
COVID-19
- US Case Count Held at 116k as the seven-day average was generally stable per the CDC with seven-day average US deaths moving up to 375 (which was less than half the rate per million in highly restrictive New Zealand and Israel, and about the same rate as also-restrictive Germany). Per Walgreens’s COVID-19 tracker (click here for the link) below, Omicron infected a higher proportion of those that had not received shots versus those that had (193k total tests, overall 37% positivity rate with 40% for unvaccinated and 39% for three doses received over 5 months ago). States of emergency were declared in certain cities and states over monkeypox, which is communicable via direct exposure to bodily fluids – i.e., “amorous contact.” Stand six feet apart and stop the spread!
- Our thoughts and prayers go out to those taken ill and we hope that they have access to proper care and recover fully.
Ukraine
- Russia Made Limited Gains in July, consolidating territory taken in the south-east and east. Foreign-supplied heavy weaponry (tanks, missile systems and artillery) slowly made their way into Ukraine with some effectiveness – if nothing else, Russian offensive pressure was lightened. Ukrainian c
 ounter-offensive rumors circulated but apart from around Kharkiv in the north-east, little actual movement was reported. Again, summer weather can alter the war on the ground quickly.
- Ukrainian Corn Sea Exports had their first cargo of 26,600 tons (about 0.1% of their estimated exports for this year) reach Turkey safely though it was unclear whether Russia will allow the next 17 grain ships to depart under the UN-brokered deal. Ukraine’s grain exports rose 21% to 1.7m tons in July from the previous month with corn accounting for 1.2m tons. However, before the war, Ukraine regularly shipped 5-6 million tons of grain per month.
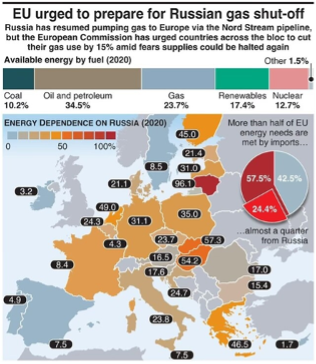
- European Gas Pipeline Imports declined after the Nord Stream pipeline reopened after maintenance… but reopened to only 40% capacity and subsequently fell to 20% flow because of “further needed repairs.” In fact, as of the beginning of August, the US was sending more gas to Europe by ship than Russia was by pipeline, according to data firm ICIS! To the right is a convenient map of the pre-war energy dependence of Europe – the EU’s call to cut natural gas use as soon as possible by 15% looks like a necessary but insufficient condition to them regaining energy and economic balance.
Macro: US
- US Consumer Price Inflation reached a 40-year high in June of +9.1%, an increase of +1.3% from May, higher than expectations of +1.1%. The core CPI, which strips out the more volatile food and energy components, advanced +0.7% from the prior month and +5.9% from a year ago, also above forecasts. An index measuring rent of a primary residence was +0.8% higher in June than the month before, an acceleration from the +0.6% increase recor
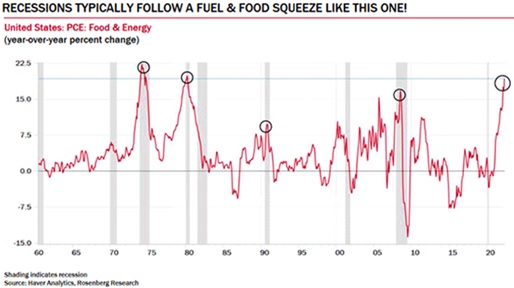
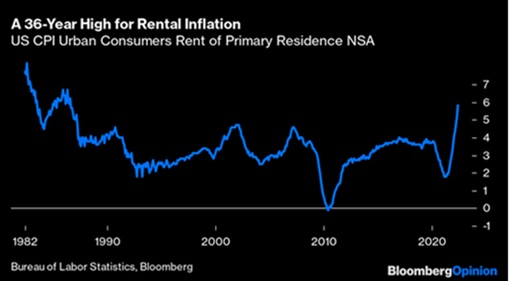 ded in May (year-on-year numbers in the graph right). Rent (or the ownership equivalent) acceleration is particularly worrisome as it hurts the largest portion of the consumer’s pocketbook and can keep the core inflation higher for longer. Other key inflation markers posted larger than expected increases – the employment cost index (+1.3% in Q2 versus +1.2% forecasted) and personal consumption expenditures price index (which forms the basis for the Fed’s inflation target) rose on a monthly basis in June by +1%, the fastest since 2005. Zeroing in on the non-core items of food and energy historically has been a sign of trouble as the graph left shows (recessions during the gray vertical bars). Looking ahead, inflation should moderate but become more persistent as while energy prices declined, food and employment costs have not. Even at half the current rate (e.g., 4% annualized), consumers will be unhappy and the Fed will be pressured to raise rates.
- But Don’t Say Recession as two negative GDP quarters (Q2 GDP fell -0.9% annualized after the -1.6% in Q1) are not sufficient according to those at NBER. Importantly, so far, current unemployment has stayed low. However, there was a modern recession where employment was still improving at first – the November 1973 recession had increasing payrolls for its first eight months until employment fell off. Other metrics are mixed – office occupancy rates are low (generally below 50%) but improving slowly. Employment was very strong at +528,000 non-farm payrolls (about double the forecast) and a lower unemployment rate of 3.5% in June with a tick higher in hourly earnings to +5.2% over the last twelve months (again better than forecast). Durable goods orders were robust in June (+1.9% / +0.5% core orders), handily beating negative forecasts. US retail sales also climbed in June by more than forecast, but June industrial production fell -0.2% for the month. With all this back-and-forth and given that recessions are called in retrospect, one should not get tied up in semantics.
- As Expected, the Federal Reserve increased targeted short-term rates by +0.75% and maintained the slow run-off of their balance sheet. Given the small percentage
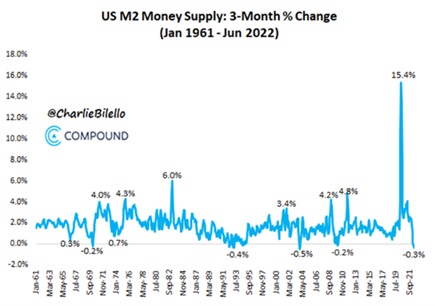 monthly decline versus the total balance sheet (currently about 1% below the peak), my guess is that it will take several months if not until 2023 before this factor has a material impact on bonds and risk assets (e.g., equities, real estate). Financial conditions have tightened (see graph right on money supply) but with the massive liquidity spike injected by the Fed during the worst of COVID, one should not expect the tightness to be over – in fact, barring a surprise at the global central bank conference at Jackson Hole in August, one should expect further rate increases in September, November and December (though not the +0.75% seen in June and July). Oh, and do not bank on cuts in early 2023.
Macro: Europe
- ECB Hiked Rates In July by +0.5% to 0.0% with the next possible increase in September. However, with year-on-year inflation picking up to +8.6% in June and +8.9% for July, clearly they are still behind the curve. Energy prices have increased by 40% over the past 12 months, with food inflation up 10%. UK inflation hit a new 40-year high in June, up +9.4%. Looking ahead, the composite purchasing managers index, which measures activity at both services and manufacturing companies across the Eurozone, fell to a 17-month low of 49.4, down from 52 in June. Trade was no help as the Eurozone posted a trade deficit in May for the seventh month in a row as imports increased due to high energy costs. Unemployment remained steady at a record low of 6.6% in June, unchanged from May. At some point, the stress of the energy deficit will accelerate – Germany had to bail out its utility company Uniper to the tune of $17 billion – and possibly more this winter should Russia continue to limit natural gas supply. If utilities will be allowed to pass higher gas costs onto consumers, Goldman Sachs reckoned that households will have to pay 470 euros (about the same in dollars) per month for electricity and gas, up +290% from the typical cost in mid-2020. How many can afford that? It still boggles my mind that Germany was so blind to placing its energy dependence to an autocratic historically-hostile power.

Macro: Asia
- China’s Trade Shifted Higher in June as exports in US dollar terms grew +18% from a year earlier. However, imports rose only +1%, showing underlying weak domestic demand. China’s Q2 GDP was up just +0.4% year-on-year, missing expectations and registering the sharpest contraction since the onset of the pandemic. That said, retail sales rose +3.1% over the last twelve months in June after a sharp -6.7% drop in the previous month. Industrial production was up +3.9%, missing expectations
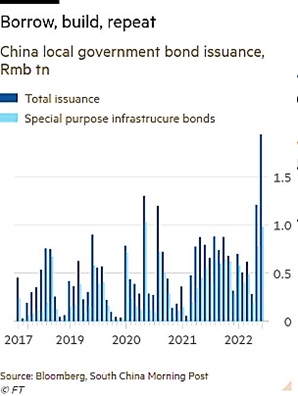 albeit rising from a +0.7% annual increase in May. Unemployment declined to 5.5% from 5.9%, however, the rate rose for those aged 16-24 to 19.3% from 18.4%. Meanwhile, China’s broad budget deficit widened to RMB5.1 trillion ($600 billion) in the first half of the year, the highest ever for such a period due to increased spending, plummeting land sales and tax cuts (Bloomberg). The graph to the right gives a sense of the acceleration of the debt. Real estate is the main culprit weighing down the Chinese economy – new development starts fell -45% versus twelve months prior. Nearly 100 housing projects lie unfinished across the country and buyers in protest halted their mortgages payments (in China, mortgage payments begin when the purchase contract is signed even when the apartment building is not yet built – not just a deposit is due). The average yield on Chinese junk dollar debt, which is dominated by developers, surged to almost 26%. For example, China South City Holdings’ $1.6 billion in debt went bad last month. Evergrande also failed to deliver its promised workout plan. Meanwhile, the vaunted Belt-and-Road financing to emerging economies continued to sour with about 16% or $118 billion of the loans requiring “negotiation” (rescue loans, write-offs, deferred payment schedules or interest rate reduction). Finally, an investigation into Huludao Risun Trading Company discovered $490 million in copper missing from a commodities storage site… this being the second shady financing situation after $1 billion in aluminum disappeared in southern China a few months ago. In short, for those that are looking to China to lead the world out of this economic crunch like the country did in 2009, they should be prepared for disappointment.
David Burkart, CFA
Coloma Capital Futures®, LLC
www.colomacapllc.com
Special contributor to aiSource