Ukraine: Winter & Sanctions Impact
The Ukraine-Russia Conflict continued its winter slog as the headlines focused on the city of Bakhmut with Russia reportedly sending in some of the 300,000 recruits mobilized late last year as the situation devolved into trench warfare. The US and Norway estimated that Russia has suffered 180,000 military causalities (dead and wounded) to Ukraine’s 100,000 (plus another 30,000 estimated Ukrainian civilian causalities). Obviously propaganda and the uncertainty of war cloud these figures. However, given the big offensives expected in the spring, 2023 should see these numbers repeated, if not higher. Put plainly, Putin’s generals need to go big or go home – so going big is the only real option. Until the weather clears up after the early rains, the war remains one of punishment and attrition.
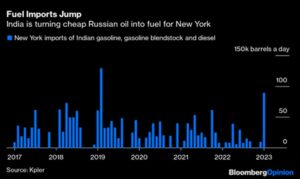
China’s Demand for Russian Energy may be well known, but India’s imports of heavily discounted Russian oil took a lift higher per the graph to the right. Russia’s export challenge is that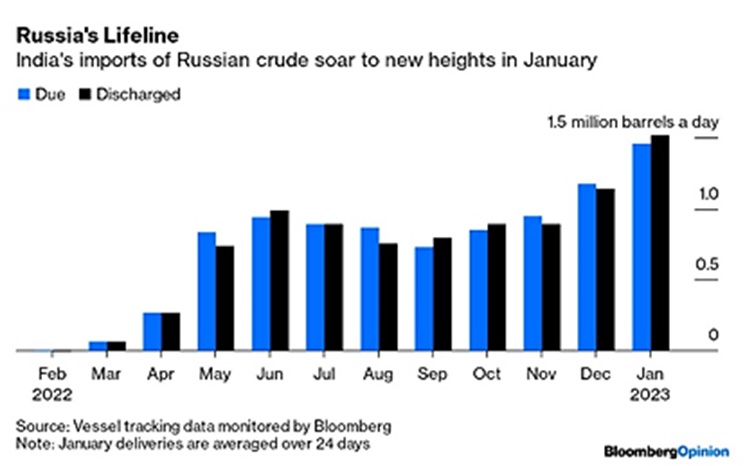 their oil tankers now have to travel 1,000’s of more miles to deliver their crude, costing valuable time and money. Then, crazily, that oil is refined and sent back to Europe and the US, with the US receiving almost record amounts of Indian gasoline, diesel and other products for blending (see left). To be fair, South Korea and Singapore also saw increases in Russian crude oil imports and China demand remained strong. Europe will be a strong importer of fuel oil to replace banned Russian supplies which means competition with Latin America for U.S. supply and/or with Singapore for Indian diesel fuel (which to repeat is made from Russian oil). Europe will be relying more on faraway supply from refineries in the Mideast and India – while acting more “green” as its domestic refineries struggle. Politics and economics make for strange companions.
Macro: Asia
China Reopening Underway but will be a stressful few months ahead, based on case spikes in Europe and the US during winter and the spread of new variants. In early December, China removed quarantine requirements for inbound travelers (though a negative test is still required) and quarantine requirements for positive tests. China’s economic data for December confirmed the economy slowed sharply in 2022 but broadly surpassed expectations for the month. Industrial production increased +1.3% y/y (versus consensus +0.2%), slowing from +2.2% in the prior month. Retail sales dropped -1.8% y/y, much better than expectations of a -8.6% contraction. Fixed asset investment growth continued to decelerate to +5.1% y/y. Exports and imports declined in December but full-year 2022 exports rose by +20.9% in U.S. dollar-terms, above the +20% increase forecast while imports grew by +19.5%, missing expectations of a +26.3% increase. Weakness was reflected in the Q4 GDP print (flat q/q; +2.9% for 2022), albeit surpassing consensus estimates (-0.8% q/q; +1.8% for 2022). China’s property data showed ongoing weakness, with home sales down -28% y/y for the full year. However, demand should recover as the number of COVID-related deaths and severe cases at hospitals in China were 70% lower than peak levels in early January. January’s Purchasing Manager Index moved back to expansion so there is hope on that front.
Longer Term, Chinese Population Is Shrinking as their government announced that in 2022 the total population fell by 850,000 people (but is still rounded to 1.42 billion), the first decline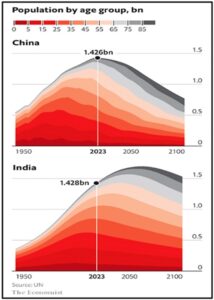 in 60 years (since the famine caused by the Great Leap Forward back in 1960). The UN projected that China’s population will fall to 1.31bn by 2050 and 767mn by the end of the century (see graphic right) while India’s younger population was still in expansion mode, not peaking until after 2060. The negative economic impact seems unavoidable between a declining population and a growing surplus of empty apartments (see graphic below). How can
  China clean up its bloated property markets and its associated debts? Recall that local governments are dependent on land sales to development companies, which already are faltering, and total (government, financial, business, and consumer) debt to GDP was approximately equal to 280% of GDP. While much lower than the US’ 770% or Japan’s 1325% (numbers from CIEC Data), the US population was forecasted to continue growing to 2100, and not age as rapidly (the UN forecast is that 40% of the Chinese and Japanese populations will be 65 or over and that of the US, UK and India will be at 30% classified as aged by 2100 per the FT right).
Tokyo Inflation Hit 4% for First Time Since 1982 beating a 3.8% rise, as the Bank of Japan widened (slightly) its trading range for its debt to allow for slightly higher (to 0.1%) interest on government ten-year notes. Deficit spending and $295 billion of additional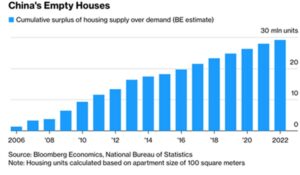 stimulus should underpin this inflationary trend. Industrial shipments fell -0.7% in December m/m, and by -3% from a year earlier, which may reverse with China’s reopening.
Macro: US
Gyrating Markets Offered No Guidance as the Federal Reserve moved as expected with a +0.25% increase in the January-February meeting and the same pace of balance sheet runoff (AKA “Quantitative Tightening”). Powell’s comments were hawkish on the face but delivered with such nonchalance that the markets took that as a bullish sign. His tone was basically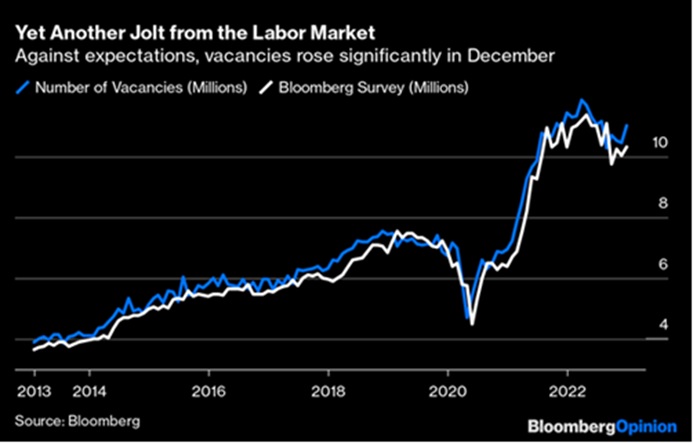 that everything is working so no need to get worked up. The next day, the payroll numbers came out and they were optically much stronger than expected with an increase of 517,000 in January after an upwardly revised 260,000 gain in December. The unemployment rate dropped to 3.4%, the lowest since May 1969 and average hourly earnings grew at steady clip (+0.3% from December and +4.4% from a year earlier, and the prior month was revised higher). The labor force participation rate — the share of the population that is working or looking for work — climbed also (to 62.4%). This narrative may seem to go against the headlines of tech layoffs and retail bankruptcies (e.g., Bed Bath & Beyond) but note that tech sector employment was less than 10% of the US workforce. Again, job vacancies were plentiful, indicating a demand for labor (see right).
US Inflation Cooled in December slightly by -0.1% to an overall rate of +6.5% for the year. The core rate increased however by +0.3% and +5.7% y/y. Shelter costs — which are the biggest services component and make up about a third of the overall CPI index — increased +0.8% last month, an acceleration from November. The median housing payment (mortgage, taxes and insurance) reached 46.4% of median income – versus 32.6% a year ago. Of course, should shelter 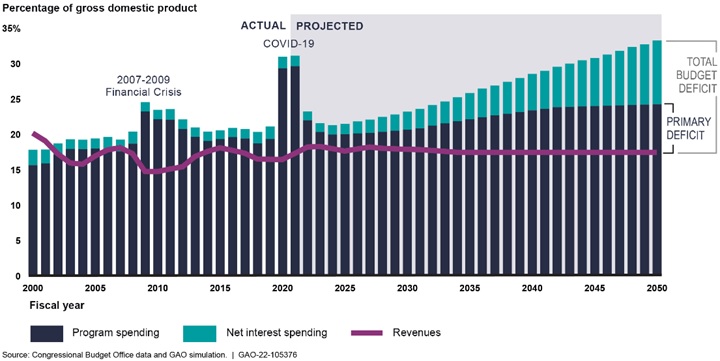 CPI start falling, the decline in inflation will be very noticeable. For now, the consumer will continue to be under stress. In other economic statistics, industrial production dropped -0.7% m/m in December, while November’s -0.2% decline was downwardly revised to -0.6% m/m. Meanwhile, retail sales plunged by a much more than expected -1.1% m/m in December, after a downward revision to November (-1.0% vs. -0.6% previously). So much for Christmas. Q4 GDP growth was healthy at +2.9% annualized. The item to watch is the perennial increasing federal deficit as a percent of GDP, projected to go from the low 20s to low 30s over the next 25 years per the CBO. As the graph to the right shows, the net interest component is driving this lack of fiscal stability.
Macro: Europe
Eurozone Inflation moved lower again in January to +8.5%, lower than the +8.9% forecasted. Again, slower growth in energy costs was the reason for moderation. However, the core rate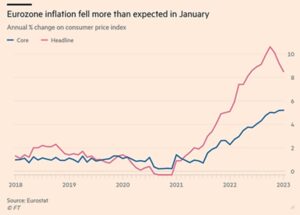 held at the record set in December 2022 of 5.2%. The European Central Bank lifted interest rates by a half-point to 2.5% (last seen during the 2008 financial crisis), with President Christine Lagarde saying another such move is almost certain next month, despite conceding that headline inflation is improving. The ECB gave details on how it intends to shrink its €5 trillion ($5.4trillion) bond portfolio, reaffirming a monthly cap of €15 billion runoff between March and June on maturing debt. Gross domestic product rose by +0.1% in the three months through December, avoiding a drop of the same magnitude and logging a gain of +3.5% for the year. However, German industrial production dropped -3.1% m/m in December, significantly below expectations (-0.7%). Despite the fall in energy prices, production in energy-intensive industries fell -6.1% m/m and is now down almost -20% y/y.
David Burkart, CFA
Coloma Capital Futures®, LLC
www.colomacapllc.com
Special contributor to aiSource

