
Americas
- US Economic Data hit a high mark with Q1 2019 GDP reaching +3.2% annualized growth, topping all forecasts that averaged +2.3%. Consumer spending was up +1.2%, better than
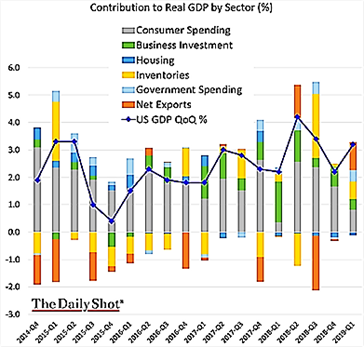 expected, with gains in inventories (+0.7%) and net exports (+1.0%) also more supportive than expected. Conventionally, these last two categories are seen as less repeatable but the US-China trade conflict may be having an impact as well. Recall also that US federal government spending was crimped until January 25th which may also explain part of the results. Hiring stayed strong in April with unemployment falling to 3.6% as payrolls rose 263,000, beating expectations. This is the lowest rate since 1969. Wages rose +3.2% year-on-year (unchanged versus March), implying that the wage-price inflation spiral is not a threat either. Total US labor participation fell slightly to 62.8%, basically where it has been since 2013. The yield curve stayed partially inverted, maintaining slowdown talk but the signal is mixed. At their April 30/May 1 meeting, Powell reiterated that he expected no interest rate increases or decreases in 2019, disappointing doves who were looking for a cut. Besides low employment figures, some other bullish signs exist. US factory orders rose by the most in seven months by +1.9% month-on-month, with core orders (ex-defense, ex-aircraft) up +1.4%. Retail sales jumped by the most since September 2017 as gains in motor vehicles and gasoline stations boosted sales by +1.6%, more than the +1.0% forecasted.
- US-China Trade Negotiations continued as US officials went to Beijing in April and their Chinese counterparts came to Washington in early May. However, Chinese draft agreements were found to be substantially different from what was earlier negotiated. Trump responded to this development by increasing the existing 10% tariff on $200 billion of Chinese goods to 25%, and setting the same increase on $325 billion of additional goods that were currently untaxed. These tariffs could cut up to 1% off Chinese GDP growth, though the estimated impact on the US is much less (3% decline on US corporate profits per CME research). The USMCA (NAFTA 2.0) ratification is still needed in the US Congress, setting up more pre-election confrontation this summer and fall.
- Other Items of note include the continued deteriorating of the pension position of some of the largest US states with the usual culprits of Illinois and New Jersey leading the way.
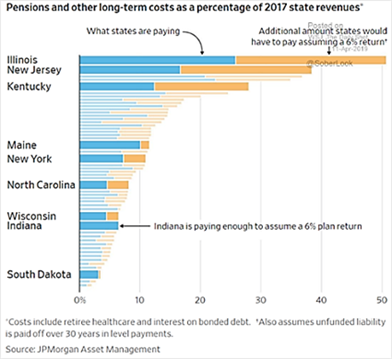 The graph to the right highlights what additional portion of the budget is needed as well as a 6% portfolio return to meet obligations. From a separate study by Pew Charitable Trusts, New Jersey’s pension system should be depleted in 2023 or so as 50% of the state’s budget should be contributed (but only 25% is currently). That’s soon!
- Not much better at the national level as the WSJ reported that Social Security’s costs will exceed its income in 2020 for the first time since 1982, forcing the program to dip into its nearly $3 trillion reserves to cover benefits. By 2035, those funds will be depleted and Social Security will no longer be able to pay its full scheduled benefits. Note that 100% of the assets are in US Treasury debts, which will further exacerbate future government deficits.
- This year, US retailers have announced that 5,994 stores will close. That number already exceeds last year’s total of 5,864 closure announcements, according to Coresight Research.
- Sales of previously-owned homes fell more than forecast in March, marking the fourth drop in the last five months. Contract closings fell to a 5.21 million annual rate, down -4.9% from February and -7.8% year-on-year. The average sale price was still higher year-on-year by 3.8% to $259,400.
Asia
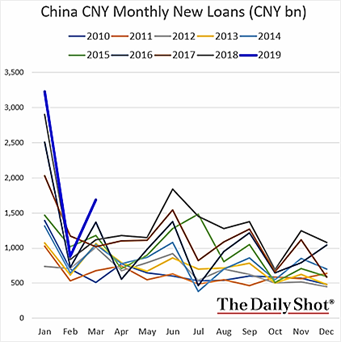
- Beijing’s Debt Spree continued with new loans the highest ever in March and 40% more debt increase year-to-date than last year (see right for month-by-month for the last ten years).
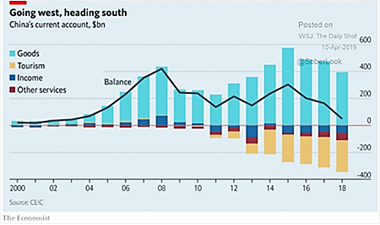
 The below graph outlines the leverage China has in its corporate debt versus GDP and households versus disposable income – even more than the US, which gets all the attention. We learned recently that the banking debt also took a swing a few years ago from having a surplus of US dollar loans to a deficit (essentially all in the Bank of China), meaning that if the CNY depreciates markedly against the USD, Bank of China will be hard-pressed to pay its USD-based debt. The trade-war situation heightens this risk. The graph with the blue background below shows the deteriorating trade balance of China, with the loss of goods exports and increase of tourism pushing the Chinese central bank to instigate such a depreciation.
 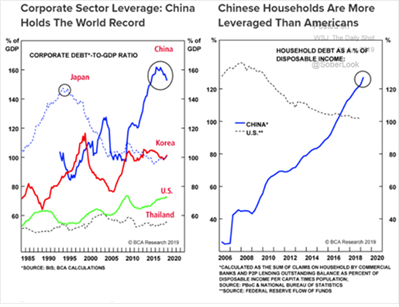 Meanwhile Chinese debt with missed payments quadrupled in 2018 from about CNY 30 billion ($4 billion) to 120 billion ($15 billion) – not big money per se but a worrying trend. Highlighting credit risk was the surprise announcement by one of China’s largest listed drugmakers, Kangmei Phamaceutical, which overstated its cash holdings by $4.4 billion in its regulatory filings. Official numbers are still rosy: g., March industrial production jumped +8.5% (versus the forecasted +5.9%) while retail sales rose +8.7% (versus +8.4%). Broad M2 money supply increased 8.6%, the fastest pace since February 2018. China imports were down -7.6% year-on-year versus flat expectations but exports up +14.2% versus +6.5% expected (largely on the US surplus – the irony!).
- Meanwhile the reverberations were felt the in the rest of Asia. South Korea’s Q1 2019 GDP missed at -0.3% on the China slowdown instead of growing by +0.3%. Japanese industrial production fell by -4.6% year-on-year instead of -3.8% and South Korea’s fell -2.8% year-on-year instead of -1.0% expected. Taiwan’s exports fell by -3.3% year-on-year.
Europe
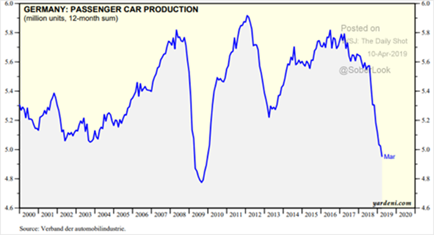
- UK Continued to Defy Expectations as better industrial production numbers (+0.6% month-on-month) and construction (+0.4% month-on-month) have led to a +0.5% Q1 GDP growth (not annualized), faster than the Eurozone as a whole at +0.4% (not annualized). German factory orders in March were below expectations at -6.0% year-on-year versus -5.4% expected, but the country’s industrial production figure came in better at -0.9% year-on-year versus -2.6% forecasted. Joblessness also fell more than expected. Overall Eurozone unemployment improved to 7.7%, the lowest in a decade. On the other hand Italy’s budget deficit is set to breach EU guidelines as economic growth was expected to be lower than projected last year (the current estimate is +0.1% for 2019 or just skating by recession). Germany also had some destabilizing results as passenger car production (a key export) fell on a trailing twelve month basis to a level last seen in the global financial crisis (see graph on the right). Social tensions within Turkey escalated as Erdogan spent 1/3rd of its reserves to prop up its currency and he overturned the election in Istanbul because his party lost. Turkey entered recession last year and economic volatility is undermining confidence in Erdogan’s authoritarian rule.
David Burkart, CFA
Coloma Capital Futures®, LLC
www.colomacapllc.com
Special contributor to aiSource