
Without question 2020 will go down as one of the most interesting years in modern history. Outside of the pandemic, which affected the entire world, the United States was going through a Presidential election year. Whether your political views lean left, right, or somewhere in the middle we felt it would be interesting to analyze and see how managed futures perform under the two presidential parties. We first wrote this article back in 2015, which you can read here and felt it was necessary to update the performance to include the last 5 years of performance data. We went back to the inception date of the Barclays BTOP 50, which includes the 50 largest CTAs in the managed futures space, to see how the index performs during years of Democrat vs Republican presidents.
First, here is a chart of the BTOP50 Index yearly performance going back to the inception of the index, which was 1987:
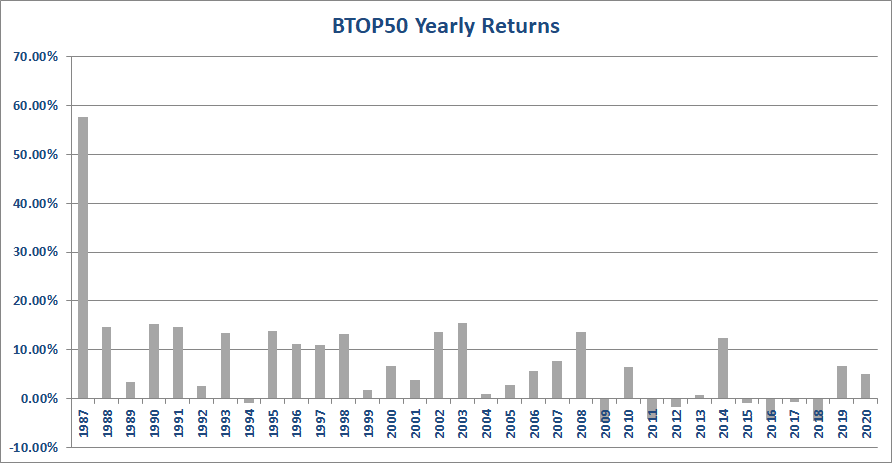
*Past performance is not indicative of future results. Index info: http://www.barclayhedge.com/research/indices/btop/
While 1987 was an outlier at 57.64%, all other yearly returns for the BTOP50 fall within the range of -5.00% to 20.00%.
If you average the annual rates of returns of years that you had a Republican president vs a Democratic president, it will look like the following:

*Past performance is not indicative of future results. Index info: http://www.barclayhedge.com/research/indices/btop/
The above results are slightly skewed due to the outlier performance in 1987. Since 1987 was a Republican president year, and the return that year was 57.64%, it is inflating the Republican Party average return. Since this was the first year that the Barclay BTOP50 index existed, we are assuming the performance in that year was skewed. If you make 1987’s return 0.00%, the Republican Party average drops down to 6.09%. Here is an updated chart assuming a 0% return for the Barclay’s BTOP50 in 1987:

*Past performance is not indicative of future results. Index info: http://www.barclayhedge.com/research/indices/btop/
While the above chart points to the fact that the Republican Party has been slightly “better” for Managed Futures, there is no direct correlation to Republican Party policies and Managed Futures performance. From a purely quantitative standpoint, it can be concluded that Republican president years have been better for Managed Futures but not by much. Obviously, there are many factors that go into the Barclay BTOP50 performance for each specific year, however it is interesting to see how the performance amongst the two different political parties are very much in line with one another.