When building portfolio proposals for prospective clients, aiSource thoroughly goes through all the CTAs included in the portfolio that a client may be investing in. A CTAs trading strategy, historical performance, and markets traded are some of the common things we discuss. Since most investors utilize managed futures as a non-correlated diversifier to their investment portfolio, it is very important to ensure that they are investing with CTAs that are non-correlated to equity markets. Thus, when we include CTAs that trade equity futures, we often get asked whether they are correlated to traditional equity markets.
Generally, CTAs that trade equity futures market are not correlated to traditional equity indices. For example, everyone knows that equities have been in a long-term bull market since 2009, however, CTAs that trade equity futures have not all had positive year-over-year performance over the same time. While this may sound “bad” since equity CTAs did not perform as well as equity indices, it actually shows that CTAs that trade equity futures are not correlated to traditional equities. Furthermore, there may be certain days when CTAs exhibit strong correlation to equities, but positive correlation over a few days is statistically insignificant.
The reason for the non-correlation is the short-term nature of the trades that CTAs place. CTAs that trade equity futures generally make forecasts that can range from one day to two months. Systematic CTAs are usually on the shorter end of that range, while discretionary CTAs could be toward the longer end. Based on the forecasts, CTAs place trades that are in line with their views. Because CTAs are more “active” in their trading, they naturally become non-correlated to the performance of the underlying market – in this case equities.
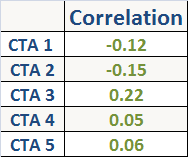
See below a table of the equity CTAs that aiSource currently allocates to, and their correlation to the S&P500 index (the most common index used when measuring correlation of varying asset classes):

Correlation is statistically significant with values greater than 0.50 or values less than -0.50. The above CTAs all have correlations close to 0 with the S&P 500 index. This means that each CTAs respective historical performance has not had any correlation to the performance of the S&P500 over the same period of time.
While the above is true for most equity focused CTAs – there may be some CTAs that have a strong statistical correlation to the S&P500 index. If there is a strong correlation between a CTAs performance and the equity index, then it’s very likely that the CTA employs a long-term trading strategy that has the potential to mimic the performance of traditional equities.
