
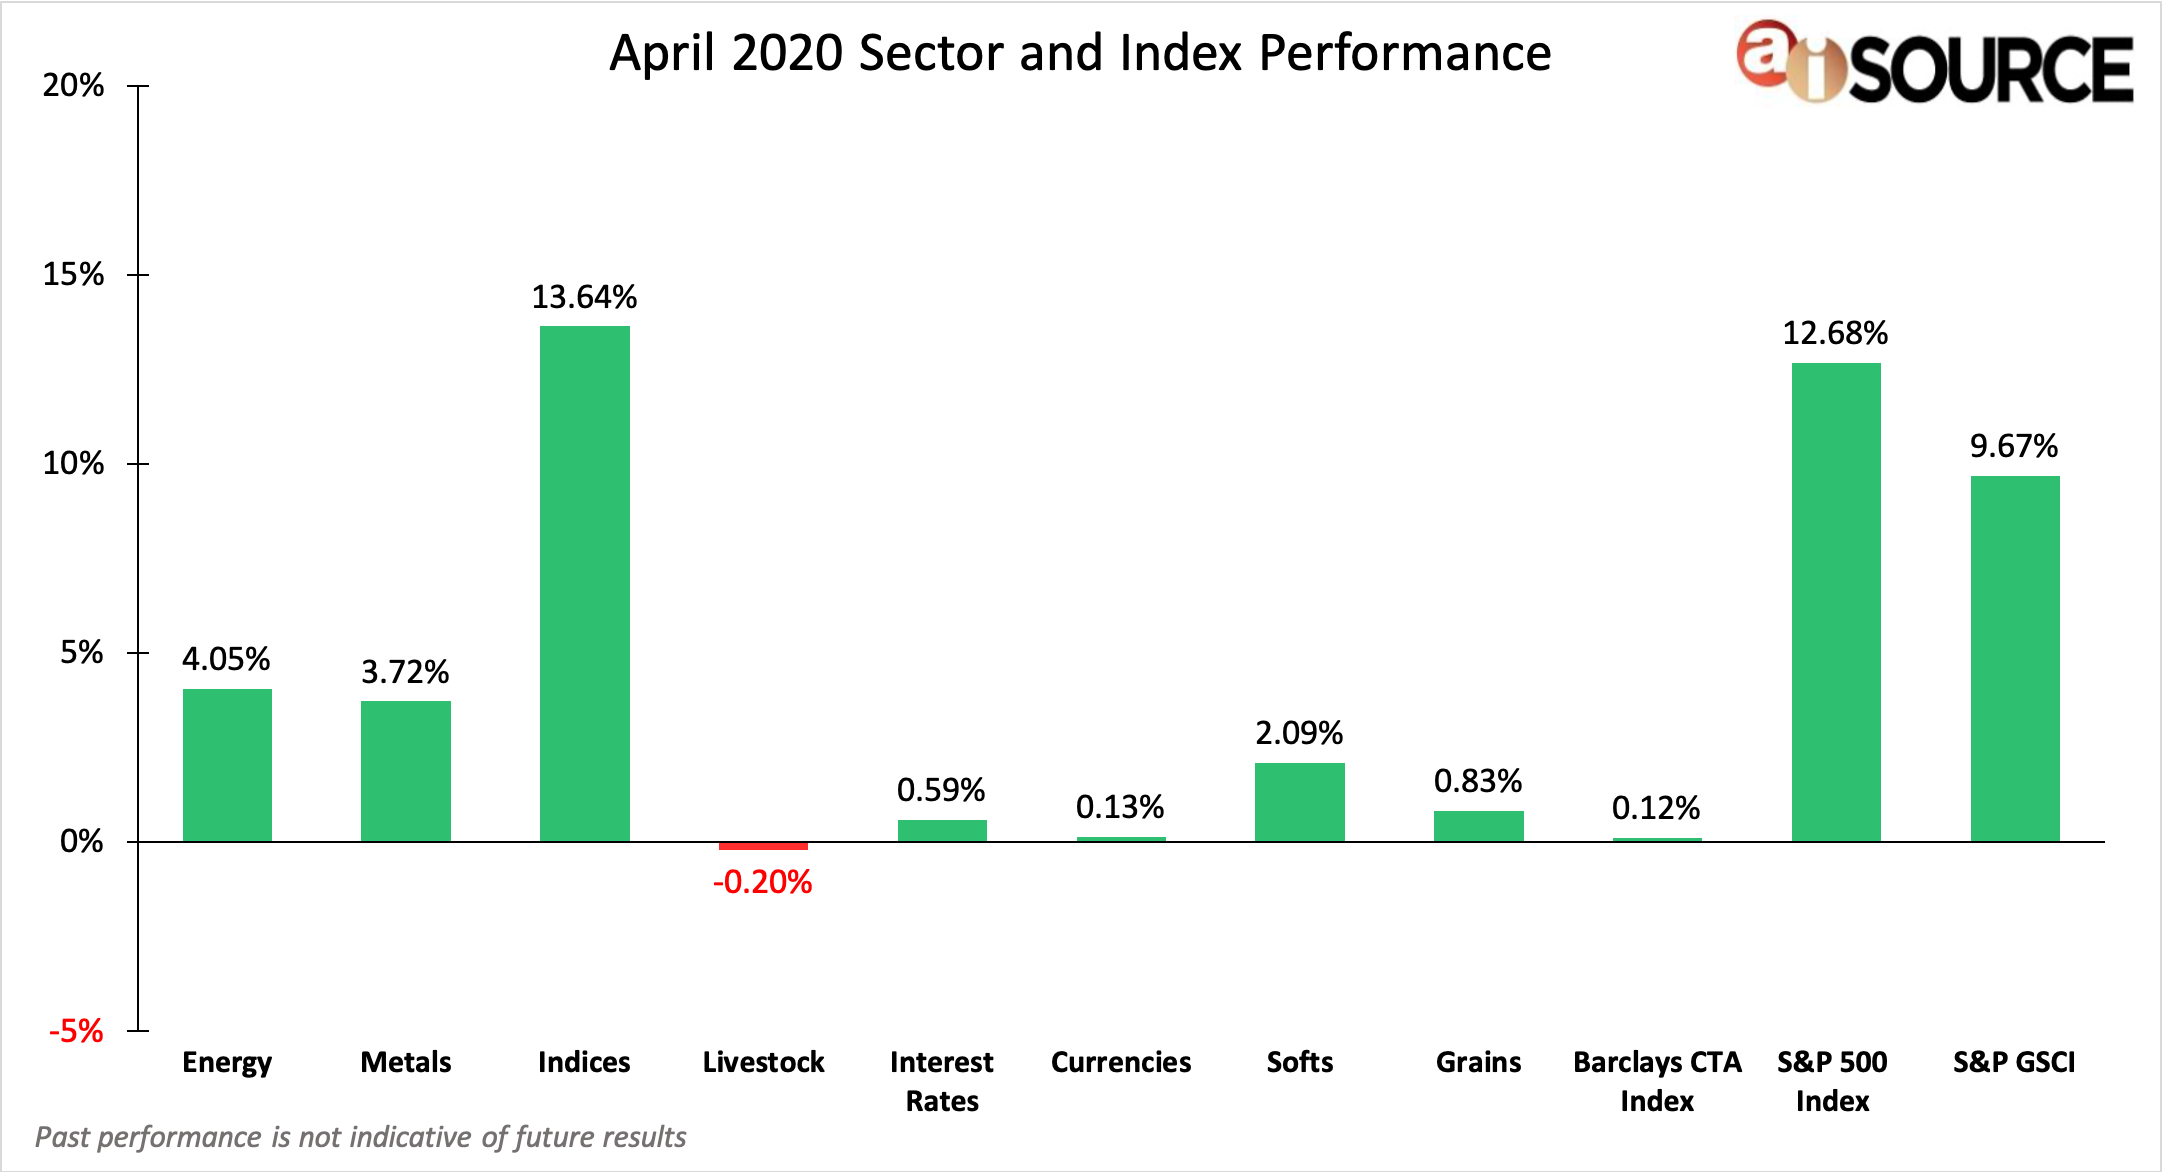
During the month of April, we saw a rebalancing of the markets and rather bullish activity as investors tried to get a grip on where we’re headed. Commodities continue to search for strength as global prices remain at lower levels. The top 3 performing sectors were: Indicies (13.64%), the S&P 500 (12.68%) and the S&P GSCI (9.67%). The bottom 3 sectors were: Livestock (-0.20%), the Barclays CTA Index (00.12%) and currencies (00.13%).
For month to date and year to date CTA rankings, please remember to visit our CTA Database. If you do not have a login and wish to register for free, please click here.
Sector & Index Performance Consists of the following:
Grains: Corn, Soybean Meal, Oats, Soybeans, Soybean Oil, Wheat, Rough Rice. Livestock: Live Cattle, Feeder Cattle, Lean Hogs. Softs: Cocoa, Orange Juice, Sugar No. 11, Random Length Lumber, Coffee, Cotton No. 2. Currencies: Euro Currency, Japanese Yen, British Pound, Canadian Dollar, Swiss Franc, US Dollar, Brazilian Real, Mexican Peso, Australian dollar. Indices: S&P 500, Mini Dow, Mini Nasdaq. Interest Rates: 30-year t-bond, 10-year t-note, 5-year t-note, Eurodollars. Metals: Gold, Silver, Copper, Platinum, Palladium. Energy: Crude Oil, Reformulated Gas, Natural Gas, Heating Oil, Denatured Fuel Ethanol. S&P 500 Index – data collected from investing.com. Barclay CTA Index – data collected from barclayhedge.com. S&P GSCI Index – data collected from us.spindices.com/indices/commodities/sp-gsci.