
Commodities: Global
- The April OPEC+ Virtual Meeting had the usual high drama as Mexico almost scuttled the deal, but the US weighed in to offer up some of its production in lieu. Even a chastised Russia ponied up over 20% of its production to make the deal happen. In summary, the deal is as follows:
- Phase I: Target cut of 9.7 million barrels per day (mbpd) for May & June 2020
- Phase II: A potential cut of 7.7 mbpd from July till December 2020 (reviewed at the June 10th meeting)
- Phase III: A potential cut of 5.8 mbpd from January 2021 till April 2022
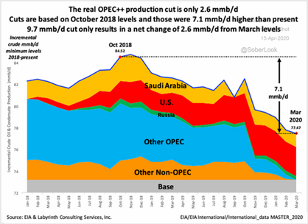 To be clear, the 9.7 mbpd cut is versus the high produced on October 2018 and is another 2.6 mbpd from March levels (see graphic left). However, the US, Brazil and Canada were to contribute another 3.7 mbpd as their production declines and other G20 states will contribute 1.3 mbpd of cuts. Technically these numbers don’t represent real voluntary cuts, but rather reflect the impact that low prices have already had on output and in theory would take months to come into effect.
- Negative US Oil Prices? Yes if you cannot take delivery but are obligated so because you bought oil futures… there was a lot of noise around the expiration of the May oil contract in the US as the price settled at -$37.63 as casual (and perhaps some
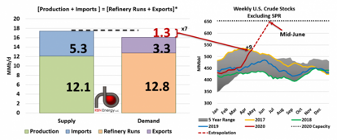 professional) traders could not believe that negative prices were possible. However, negative prices for physical delivery had been in existence for a month for some grades, such as Wyoming Asphalt Sour (as foul an oil as its name) which went to -19 cents in March. According to RBN Energy projections, at the current run rate the US should run out of storage in mid-June (see right) as US demand for oil is running about 25% lower than a year ago. It is not just a US phenomenon as South Korea ran out of excess storage space and Bloomberg forecasted that 95% of global storage could be full by the end of May. Global economic opening has been in fits and starts with a new spat of cases in South Korea and China in early May already. Also supply is at risk as the cases in oil workers has been reported in the US, Brazil and Russia. International oil rigs outside of North America were down 124 month-on-month to 651 in April to lowest level since February 2005 per consultancy Baker Hughes.
- US Oil Production Fell from 13.1 mbpd of crude oil to 12.1 mbpd at the end of April (see right) and recall the US government forecast of 11 mbpd by the end of the year. It could
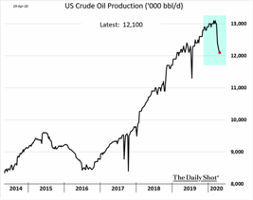 easily go lower as operating drilling rigs have impressively halved in one month, from 624 on March 27th to 325 on May 1st. US crude oil imports have fallen to 2 mbpd as dozens of tankers sit offshore both the West Coast as well as in the Gulf of Mexico. Demand for gasoline plunged to 1968 levels per the American Automobile Association in mid-April, though there are some signs of a small recovery as some US states partially re-opened at the end of the month. The graph below pictures the collapse in gasoline consumption since the start of the year. Meanwhile, the bankruptcy wave has already started. Whiting Petroleum filed, marking the first high profile Chapter 11 filing of the
 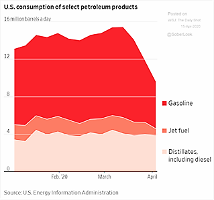 current crisis. Diamond Offshore Drilling joined the club a few days later. Fitch warned that more than $43 billion of high-yield bonds and leveraged loans in the energy sector will default in 2020. For context, that’s nearly five times the sector’s average level of defaults over the previous dozen years. The oil and gas industry shed nearly 51,000 drilling and refining jobs in March, a 9% reduction that is likely to get worse with the collapse in operating oil rigs. Those job losses rise by 15,000 when ancillary jobs such as construction, manufacturing of drilling equipment and shipping are included.
- China’s Pork Output in the first quarter fell -29.1% from a year ago to 10.38 million tonnes, as the world’s biggest producer continued to feel the impact of the African swine fever. In 2019, pork output hit a 16-year low of 42.6 million tonnes after African swine fever killed millions of hogs. Conversely, China bought 63,183 tons of U.S. pork in March, up 430% from a year ago, and $5.0 billion worth of farm goods from the United States in the first three months of 2020, up 110% from last year. China committed to buy additional purchases of U.S. agriculture products totaling $32 billion over two years, under the Phase One trade deal. Brazilian soybean exports in April reached 16.3 million tonnes, an all-time record for a single month and an increase from 9.4 million tonnes in same month last year. Their 2020 soy harvest ran at the usual pace and will soon be almost complete. Meanwhile in the northern hemisphere, US corn planting was 51% complete at the end of April, which is well ahead of the 5 year average of 39%, and also last year at this time when only 21% of the crop had been planted. Soybean planting was 23% complete, also well ahead of the 5 year average of 11% and last year at this time when only 5% of the crop had been planted. The big unknown will be the number of acres planted though current estimates of 97 million corn acres and trend yields could result in a corn crop of 15.8 billion bushels, or 16% higher than a year ago. Then again, a revival of the US-China trade scuffle could throw out the Phase One deal, diverting planting to soybeans or other crops, or sending the corn harvest to the bin. Ethanol and feed prices will likely see continued pressure even with a revival in oil and livestock prices. At least the Trump administration announced a program to buy $3 billion in farm goods ($300 million per month) to support charities with food boxes as people struggle with unemployment and uncertainty.
- Our Bottom Line is the global GDP recovery is the question and as the above sections discussed, the shape of that recovery is an open question. Our personal un-scientific view is that it will be a “check-shaped” recovery – a sharp down slope at first and a more gradual upward slope after the bottom. Will that bottom be in Q2? We suspect so as long as economically-vital US states such as California and New York open up and there is no serious double-dip in Asia. In the financial markets, however, it is a race against time for both debtors as well as creditors to avoid the bankruptcy mire.
David Burkart, CFA
Coloma Capital Futures®, LLC
www.colomacapllc.com
Special contributor to aiSource