The grain markets have been screaming up the entire month of April. The move isn’t unprecedented, as grains have historically had many strong rallies, but this is the first time grain prices have rallied this much since the 2012 and 2013 growing seasons. On their April highs, soybeans were up as much 13.75% for the month, and are still up 8.10% for the month as we speak. Similarly, corn was up as much as 14.50% for the month in April, and is still up 6.8% for the month. As a managed futures investor, the question is how are grain CTAs responding to this massive move – we’ll discuss CTA performance below after reviewing some charts.
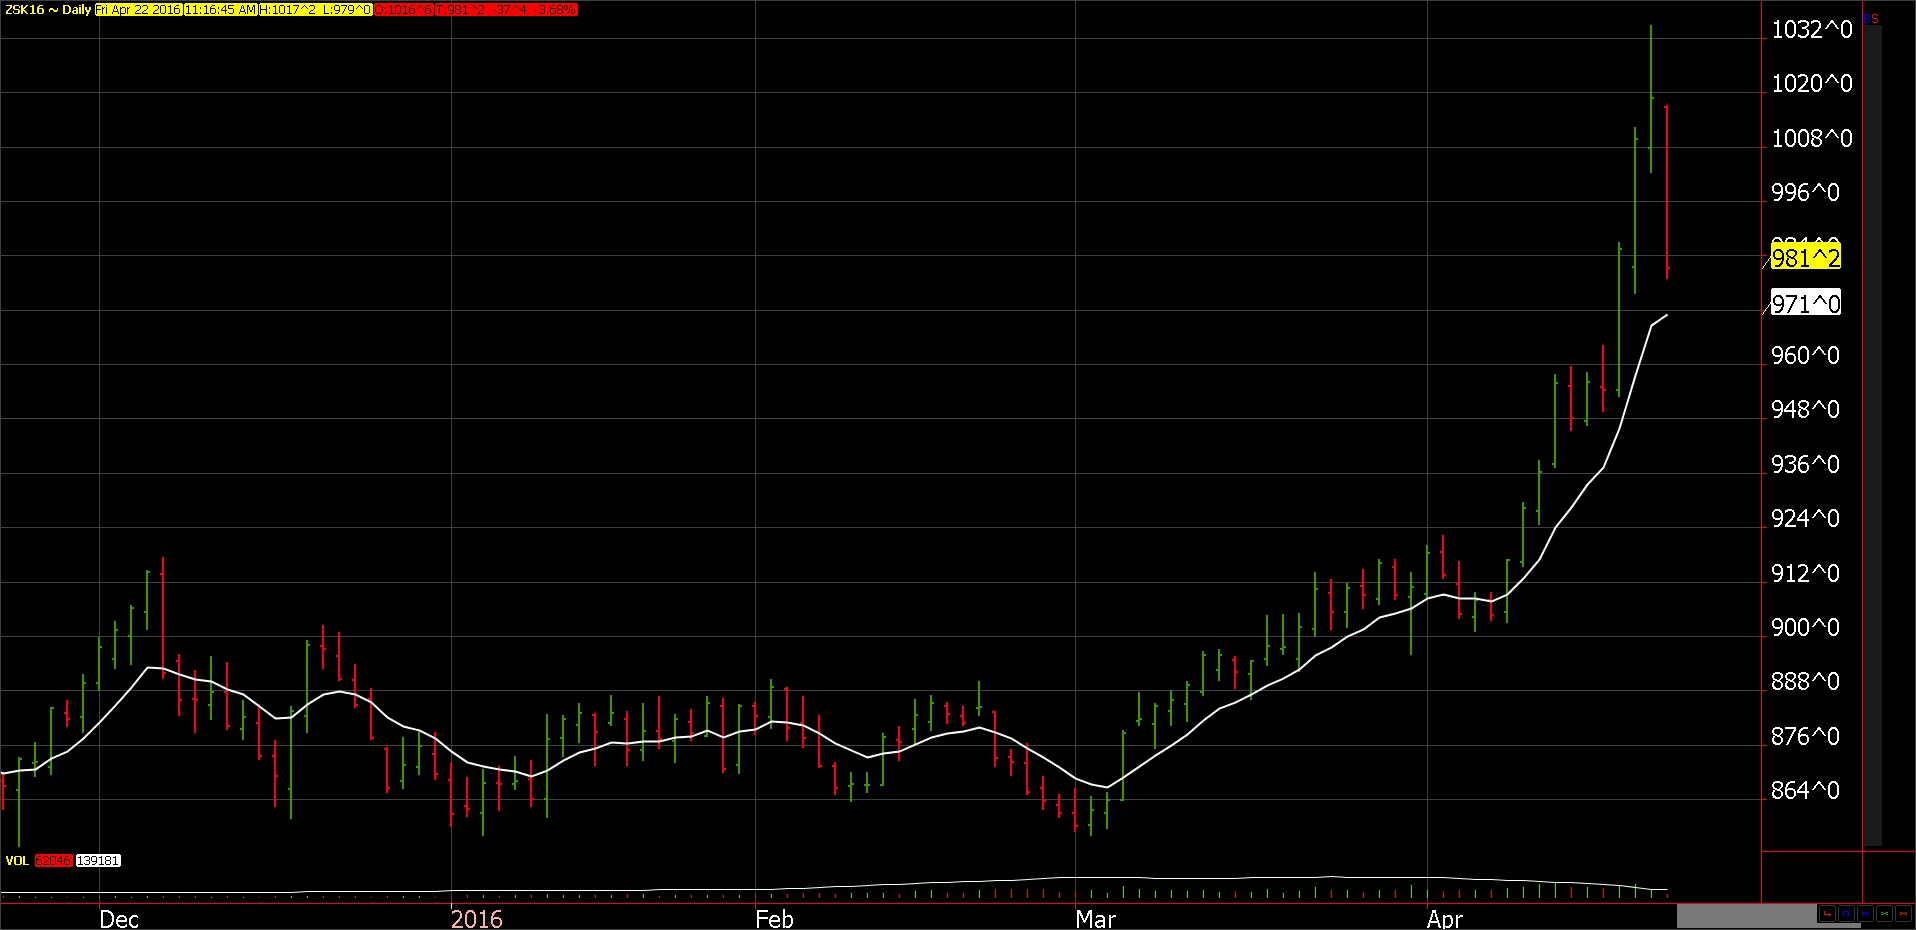
Here is a daily chart of May 2016 Soybeans:
As you can see above, Soybeans have been slowly rallying since early March 2016, but they really took off after the first week of April. Despite the big down day today (April 22nd, 2016), the gains made in April are still very large.
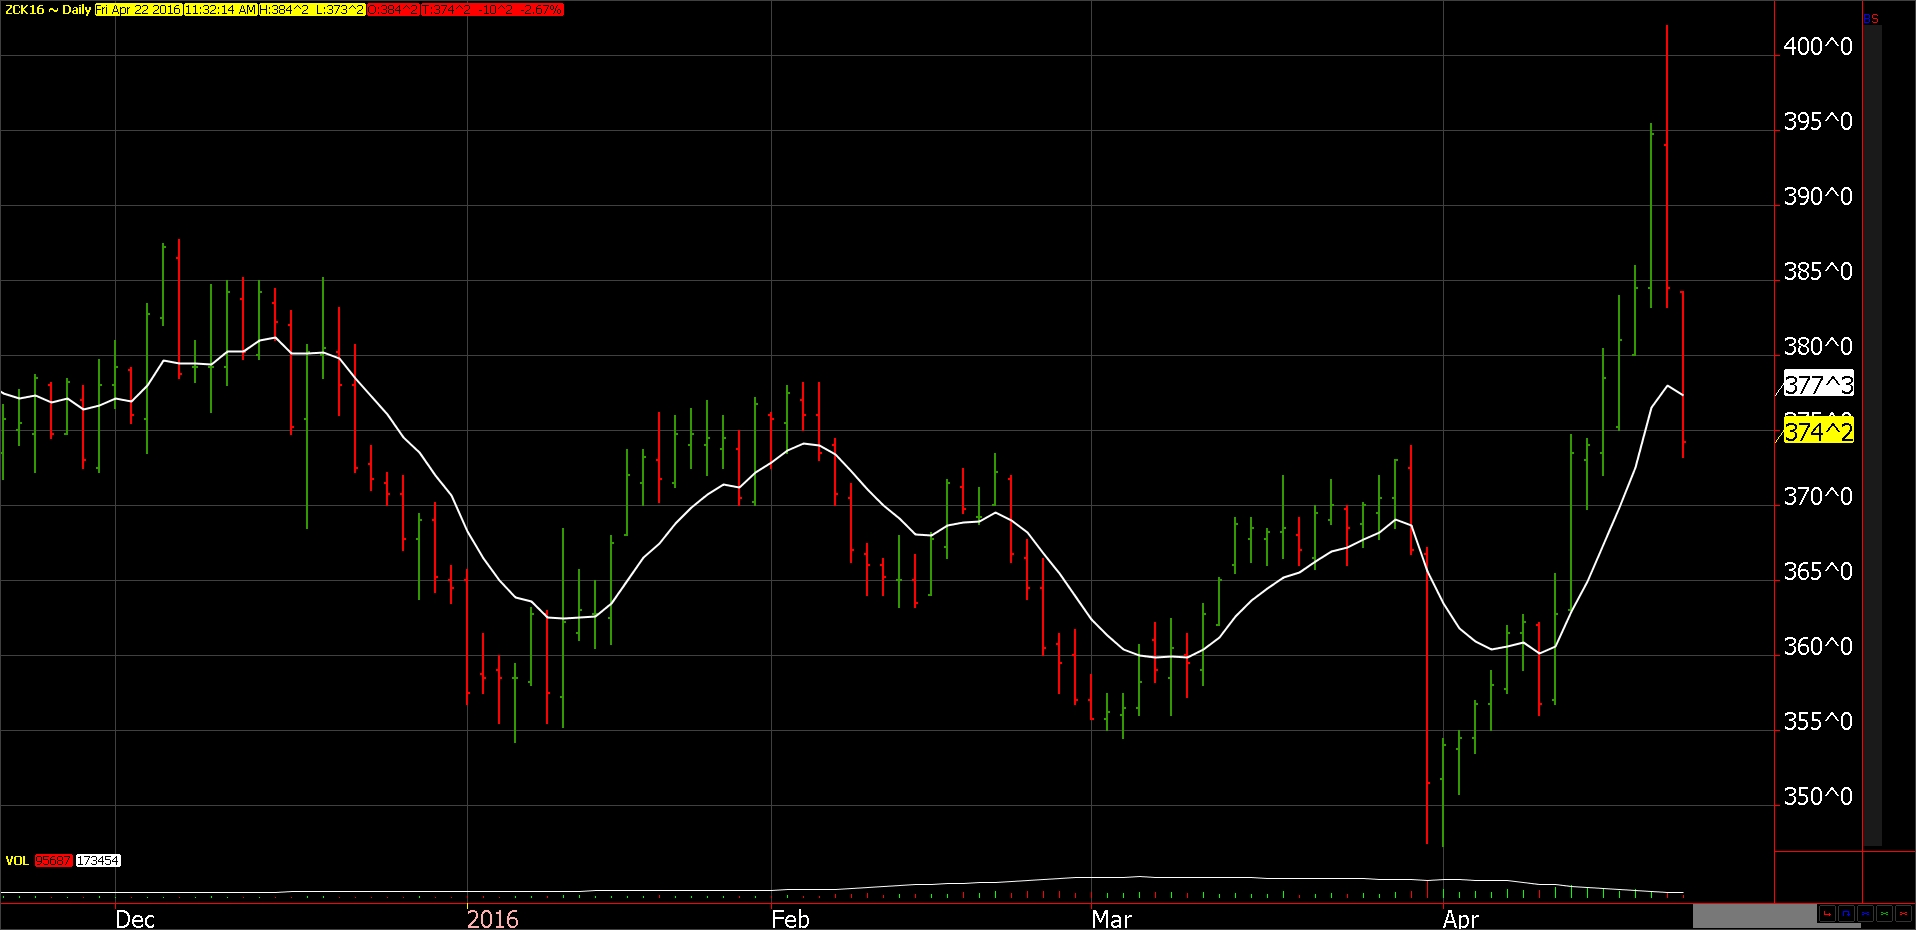
Here is a daily chart of May 2016 Corn:

Similar to the story in Soybeans, Corn rallied in may, but had large sell offs the last two days of that month. Once April started, the rally continued, but the last two days have eliminated a large portion of the gains in Corn.
There are mixed opinions behind the cause of the rally. The planting intentions report from March 31st, was bearish for both soybeans and corn, but large amounts of rain in South America may have helped curb the bearishness of the US report. Other analysts believed there was a lot of fund/speculative demand that has been driving the price up for grains. If the rally is not caused by fundamental factors, but instead caused by fund buying, then this rally should be ending now [and until fundamentals dictate prices to go higher].
Grain CTAs Performance in April 2016
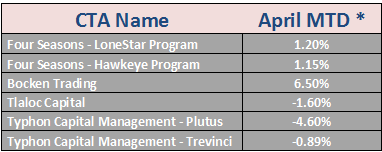
A managed futures investor is more concerned about how CTAs are reacting to the price moves in the grain markets and how they are performing under the current conditions. Here is a mid-month update for April 2016 performance for some of the grain specific CTAs that we allocate client assets with:

*Above numbers are as of the close on April 21st, 2016. Performance numbers are based off one individual client account. Performance may slightly vary from overall CTA performance due to differences in fees/commissions. Past performance is not indicative of future results.
As you can see the results are mixed when it comes to performance. Out of the six strategies, three are positive for the month, while three are negative. The volatility (both upside and downside) for each respective CTA is within their historical ranges.

