At aiSource, we believe that monthly rate of returns reported by CTAs only tell half the story. By looking at monthly returns, you’re only reviewing a small data set of numbers; for example, a three year track record has only thirty six monthly returns (i.e. 36 data points). Since investing through managed accounts allows investors to have daily transparency and performance reporting, it’s important for an investor to analyze daily returns in order to get a better idea of what to expect when investing with a CTA. Therefore, the same CTA that has a three year track record, may have close to 600 daily returns (600 sets of data), allowing for a more statistically significant analysis.
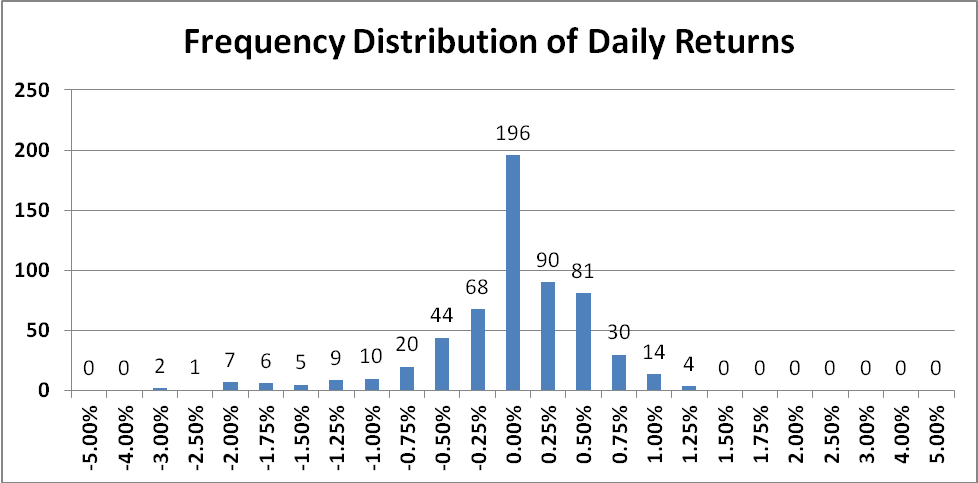
Since there are many analyses that can be performed on a set of daily numbers, we are going to divide them up over several newsletters. In this newsletter, we will be discussing the frequency distribution of daily returns. A distribution of daily returns shows where most of the daily returns fall (based on 25 basis point intervals), and shows an investor what type of volatility to expect on a daily basis. Here is a sample frequency distribution of daily returns:
Initially, it looks as though this set of data is positively skewed, with a high number of daily returns between 0.00% and 0.75%. However, if you look at the tails, you’ll notice the left (negative) tail is much longer than the right tail. What this is telling us, is that this CTA has large losing days, but does not have winning days of equal magnitude. For example, this CTA had two days where they lost greater than 3%, but they had no days where the made more than 3%. In fact, this CTA has never had a day where they made more than 1.50% – not a good sign given their negatively performing days.
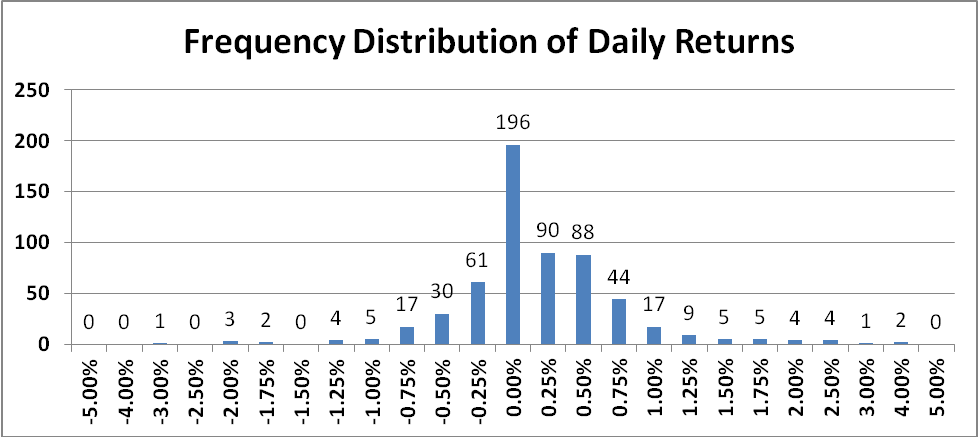
Here is another frequency distribution of daily returns from a different CTA:
This set of daily data is quite similar to the one we previously looked at, except that it has a bigger cluster of daily returns that fall between 0.00% and 1.00%; this signals that this CTA has many days with positive performance. Second, this CTA’s tail is longer on the right (positive) side. There were a total of ten days with returns that fall between 2.00% and 4.00%, but there were only four days with negative returns between 2.00% and 3.00%. There were no negative days with losses greater than 4.00%; a great sign.
Without daily return data, it would be impossible to do the above analysis. Looking at a CTAs monthly returns, it’s impossible to see data at granular level. Furthermore, since most investors that invest through SMAs experience volatility on a daily basis, it’s important to look at frequency distributions to learn what you ar getting yourself into. If daily volatility greater than 1% was too high for an investor, then they would look at the above distribution and decide that this investment is not for them.


