
“Men make their own history, but they do not make it just as they please; they do not make it under circumstances chosen by themselves, but under circumstances directly encountered, given and transmitted from the past. The tradition of all the dead generations weighs like a nightmare on the brain of the living.” – Karl Marx
“If the US is ‘too big to fail’… will there now be plans to break it up?” – Letter to the Financial Times
Relief over the deficit / debt debate sparked a rally in the S&P 500 in October, gaining a hefty 4.6% for the month. A “grand bargain” to delay the debt ceiling reset in exchange for more budget wrangling seems just the half-way measure that we world citizens should expect. I suspect that there will be a nice spending push before the end of the year, front-loading the deficit to allow for a higher debt ceiling when the deal is finalized. This happened before when military spending was accelerated before the first sequester took effect. To me, it is the kind of faux-recovery that can artificially skew the economic results upward at year-end. Across the ponds, Europe to the east is making more positive noises than before, though China to the west still seems to be meandering. In the commodities zone, overall supplies are catching up with demand, pressuring prices. Energy, grains, metals (both industrial and precious (sorry goldbugs)) and softs all show good inventory levels. Only livestock appears in tight supply. Those looking for goods inflation will be hard pressed to find it in food and clothing. Asset inflation – housing, equities, bonds and luxury goods – are showing the symptoms instead. Popping those pseudo-wealth-effect bubbles is going to be Yellen’s challenge, if she chooses to take it.
Back to Work! Brinkmanship is clearly in fashion with the shutdown ending after sixteen days and right before when the Treasury was getting genuinely nervous about juggling cash around the $12 billion Social Security payment on October 23rd. While I believe that there were funds to handle that payment, the November 1st payments for Social Security and Medicare of $43 billion total would be much more tenuous. However, the nation was saved until December 13th, by which time a deal is supposed to be hammered out and passed by both houses of Congress. This “deadline” of course may be pushed to early 2104, however, the sequestration cuts are due to take effect in January 2014. Defense spending faces the largest cuts of $20 billion from 2013 levels while non-defense spending is largely unaffected. Also the debt ceiling has been suspended in the meantime so that the Treasury can borrow as much as it wants before it is reset. And borrow it shall – after the five months of non-borrowing during the period when the US debt was up against the ceiling from May to October, the public debt moved up $328 billion the first day the that ceiling was lifted – to over $17.07 trillion. The whole spectacle caused Fitch (who?) to put the US credit rating on watch for a downgrade. Readers may recall that S&P lowered the country’s rating back in 2011. Perhaps they were a bit early, but with the sequester last year and the debt ceiling drama this year, not by much. Another factor in the negotiations will be the end of the three-year temporary increase of food stamp payments, with an annual cost of $16 billion. Perhaps if the IRS halts the overpayments in earned-income tax credits equaling $11 billion annually during each of the ten years from 2003 to 2012[1] could replace that food stamp funding.
A government shutdown did not stop Yellen’s nomination for the top position of the Federal Reserve. While a non-surprise given Summers’ withdrawal after pressure from Democrat senators, it provides another lightning rod for debate in the next two months. Despite recent spin to the contrary, she will focus on the employment side of the Fed’s duel mandate, which means low interest rates and continued extraordinary monetary measures, like QE. She said so in her nomination acceptance speech, and has been consistently to the dovish side of Bernanke. Is she experienced and qualified? Absolutely. Does she have the policy view needed by this country and the world, in my humble opinion? Absolutely not. With a nod to John Mauldin, QE-driven asset bubbles in the housing, stock and bond markets create wealth for the already wealthy, and thus any broad-based recovery stems from “trickle-down” monetary policy. Democrats have blasted Republicans for “trickle-down” fiscal policy in the past but they are also engaged in these ineffective shenanigans. Needless-to-say, the Federal Reserve did not instigate any tapering at the October meeting, nor I think will do so for an extended period of time. Too many connected people are getting richer on the policy: to quote Iain Stealey, a portfolio manager at JPMorgan, “Markets love QE, and this is going to make QE last longer.” Just to cite the latest signs of an unfolding financial bubble (besides stock market margin debt at an all-time high), there has been a pick-up in the issuance of paid-in-kind toggle notes, which gives the borrower the option to pay interest with more bonds instead of cash. With $9.2 billion sold so far in 2013, one must go back to the bubble days to find similar levels of issuance. At least the potential damage from QE is affecting the IMF’s latest projections for US GDP growth for 2014 as it cut 0.2% off its projections for a full-year figure of +2.6% while citing QE effects as driving its decision. Its 2014 global projection of +2.9% is the lowest for the post-crisis era. Let the stagnation continue!
It’s All Good Apart From the Growth: While Spain and the UK caused a bit of a stir in late October with some positive Q3 GDP growth (+0.1% and +0.8%, respectively), the EU still knocked down total Eurozone growth in 2014 from 1.2% to 1.1%. With France and Spain expected to miss their deficit targets, austerity is expected to stay in the driver’s seat. Portugal just passed the harshest budget yet as demanded by its bailout terms but still projects debt to be 120% of GDP in 2014. Since their supreme court has revoked past austerity budgets, the same is expected this time around, wasting more time and energy on the process. Spain at least was able to take advantage from its positive-sounding news to issue a 30-year bond at 5.21%, its first such long tenor in four years. Debt to GDP is still on track to hit 100% in the next two years and unemployment is 26.2% (double that number for youth unemployment) so they are not out of the woods yet. Spanish banks still have to raise €5 billion, though that is less than first estimated, as well as the government-sponsored “bad bank” of toxic loans is planning to start selling some of its €50 billion in bad assets next year. Greece is still negotiating with the troika over its austerity measures as it claims that the financing gap is only €500 million but the EU / IMF peg the number at €2 billion as a tax on entrepreneurs, and government employee salary and pension cuts were not implemented. With the IMF not willing to put more money into Greece (and apparently interested in getting paid out first), Greece’s situation may prove difficult as the decision for the next €1 billion in aid comes in November. The European Union’s new sovereign bond bailout fund, the European Stability Mechanism (ESM – which replaces the previous fund known as the EFSF), was funded in early October, raising €7 billion from the bond market, with more money to be raised later this year and 2014 (another €26 billion) for Spanish and Cypriot lending. It may need to do more as troubled European bank loans continue to increase – hitting €1.2 trillion of non-performing assets per a recent PwC study. But to end on a plus note, European car sales were up in September, particularly in Spain and France. Of course, September is a high-sales month seasonally and this year was the second-worst since 2003. Well, I tried to end on a positive note at least.
As Goes China, So Goes the World: To finish off the IMF projections, they pared back China by 0.4% to a +7.3% GDP growth for 2014. India was pounded with a 1.8% cut to +3.8% GDP gain for 2013, though 2014 is more robust +5.1%. Industrial growth as measured by PMI has held up well in Asia, with China, Taiwan, Indonesia and South Korea in expansionary territory. There is some concern over slower growth in exports but overall activity was stronger than a year ago. The question with China is how long it can keep growing at its current pace. GDP growth looks highly correlated with industrial output growth (see graphs from Wall Street Journal below) and while the recent number was supportive, it underscores China’s dependency on external demand, pollution and competition from lower-cost or more value-added factories. At an average $7000 per capita income, China has reached the area where other Asian economies (Japan, Korea and Taiwan) where growth began to slow from near double digits to 5-6%. Home affordability is a national issue, though concentrated in the 70 largest cities, which are up 8.2% year on year in September, another high, three years after the central government announced that it is trying to manage home prices. On the external demand side, Chinese exports match about 12% of GDP, where both Japan and Germany maxed out in their post-war recoveries. Finally, manufacturing is 30% of Chinese GDP, where the peak was in Japan (back in 1970). There is room for efficiency gains through infrastructure buildout – much of the coal burnt in power plants is shipped by truck, which can be shifted to rail. In comparison, Japan spends about 5% of GDP on logistics (and is a much more concentrated country) and China spends double that. Therein sits the opportunity.
But how to fund it? Chinese banks are reporting increases in bad loans despite increased profits – Industrial and Commerical Bank of China (ICBC, China’s largest bank by market value) reported 7.6% higher profits in Q3 and also a quarterly 7.5% increase in bad loans. The sector average is 1% bad loans as a percent of assets, which is more a reflection of rolling over bad debt (“expend-and-pretend”) and a fast pace of new lending, rather than true quality. In fact, China embarked on an official project to tally up all the country’s debt as the rapid pace of local financing has dramatically increased (see graph on right). Estimates reportedly vary so widely, the amount of local government debt range from 30-60% of GDP! Chinese 7-day interbank rates spiked at the end of October hitting almost 7% annualized though they have since calmed down. This is the highest since the massive June move (28% intraday highs at one point) and was considered another shot across the bow by the central bank to the financial markets that it wants adequate reserves and some prudence in lending. Thailand announced plans to raise $15 billion and Pakistan is returning to international bond markets for the first time in six years and is expected to offer up to $1 billion. Despite the froth in bond markets these days, it is still possible to run into problems. Barbados (yes, not in Asia but proves the point) failed to raise $500 million due to solvency issues and may now be seeking IMF assistance. Like Detroit and other problem borrowers, the problem had been building for years and only recently did the situation turn pear-shaped. A reminder that profligacy works until suddenly it does not, and then there is a crisis and extreme loss.
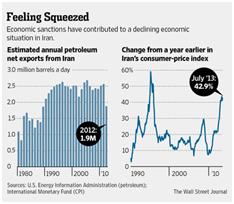
Plenty of Oil…Or Not! We are living in a veritable age of plenty here in the US – shale.png?sfvrsn=4 "US Fuel Exports (Barrels Per Day)") oil production up, Gulf of Mexico oil production up, Canadian oil production has no place to go besides south of the border. In fact, oil has been piling up not only at the Gulf where much of the US refining capacity sits but has been backing up to the traditional delivery point at Cushing, Oklahoma. Crude stockpiles in the US had grown for six straight weeks to the end of October, and the inventory at Cushing reached 35.5 million barrels, just a few million below the record. All this crude is not for a lack of processing – US refiners have exported record amounts of fuel – in July, 3.8 million barrels of oil products left for the world all over, a 65% increase since pre-shale boom started in 2010. US auto manufacturers have benefited as lower gas prices improve affordability – even in San Francisco gas prices are in the $3.75 range, with the national average at $3.22. GM sales were up 16% year-on-year in October with Ford and Chrysler close behind at +14% and +11%, respectively. Nissan (+14%), Toyota (+9%) and Honda (+7%) also put in good showings. As exciting as all this is for Americans, the idea that that European and American sanctions may be lifted against Iran could really expand oil supplies, as that country desperately needs funds to cover its social programs and overseas adventures. From an OPEC perspective, oil production is actually down to its lowest output in two years, at just over 30 million barrels per day (bpd). However, with the disruptions in Libya, Venezuela and Nigeria, production has been more
oil production up, Gulf of Mexico oil production up, Canadian oil production has no place to go besides south of the border. In fact, oil has been piling up not only at the Gulf where much of the US refining capacity sits but has been backing up to the traditional delivery point at Cushing, Oklahoma. Crude stockpiles in the US had grown for six straight weeks to the end of October, and the inventory at Cushing reached 35.5 million barrels, just a few million below the record. All this crude is not for a lack of processing – US refiners have exported record amounts of fuel – in July, 3.8 million barrels of oil products left for the world all over, a 65% increase since pre-shale boom started in 2010. US auto manufacturers have benefited as lower gas prices improve affordability – even in San Francisco gas prices are in the $3.75 range, with the national average at $3.22. GM sales were up 16% year-on-year in October with Ford and Chrysler close behind at +14% and +11%, respectively. Nissan (+14%), Toyota (+9%) and Honda (+7%) also put in good showings. As exciting as all this is for Americans, the idea that that European and American sanctions may be lifted against Iran could really expand oil supplies, as that country desperately needs funds to cover its social programs and overseas adventures. From an OPEC perspective, oil production is actually down to its lowest output in two years, at just over 30 million barrels per day (bpd). However, with the disruptions in Libya, Venezuela and Nigeria, production has been more concentrated with Saudi Arabia primarily picking up the slack. Persian Gulf producers have reached all-time highs in production at 16.4 million bpd (up from 13.7 million bpd in January 2009) while non-Gulf OPEC production has slid from 15.4 million bpd to 13.6 million bpd. US shale has not displaced Saudi Arabia and its neighbors, defying expectations. With Shell set to leave much of Nigeria, its production could continue to slip. Meanwhile shale production in the US continues forward with the latest statistic showing that the average well produces 78% more gas/oil equivalent today than at the end of 2010.
Those big fuel exports are undercutting European refiners, who reportedly have negative gross margins thanks to higher oil costs and greater supplies of diesel to contend with from the US. Per oil industry consulting firm Wood Mackensie, their benchmark refining gross profit measure was -$1.7 per barrel in September. 500,000 bpd in European refining capacity closed in 2011 and 2012, with 2013 a possible third year, as the industry battles direct costs and higher regulations. Turning to natural gas, Canadian natural gas exports to New York State for heating have collapsed from 800 billion cubic feet in 2007 to less than 300 billion cubic feet in 2011 (the last year that data is available). Trucking fleets are shifting to natural gas, as Lowes, Proctor & Gamble and United Parcel Service are all purchasing compressed natural gas (CNG) vehicles as CNG is roughly 60% the cost of gasoline or diesel.
Chinese rice production has hit a plateau as land has been shifted from farming to industrial and residential uses (see our discussion earlier this year on the coercive tactics used by local governments to steal land from farmers to benefit developers and themselves) and yields are falling as the replacement acreage is less productive due to worse weather and soil in the desert North versus the tropical South. Rice imports from Vietnam and Thailand cost 10% less than domestic rice as shipping costs and food-safety risks are lower. Even the US sends China rice. Also China is in the process of cutting its government cotton stockpiles as local clothing companies are losing business to cheaper India and Pakistan. Readers may recall the Chinese government massively buying cotton a few years ago and seeing photos of cotton farmers with their homes literally filled with cotton. In food company news, Kellogg plans to cut 7% of its workforce (i.e., by 2000 employees) and reduce capacity by 2017 in order to maintain profitability. Global food giant Cargill reported a drop of 41% in its net income as lower grain supplies reduced processing revenues. Meanwhile in Mexico, the government has passed excise taxes on sugary drinks and food in order to combat obesity – seven of ten adults and three of ten children are considered overweight or obese, now surpassing their US neighbors for the title of fattest country in the OECD. Given that seven times the Mexican population has diabetes versus the average OECD country, improvements there could have a real beneficial economic effect.
David Burkart, CFA
November 12, 2013
Additional information sources: Bloomberg, Financial Times, New York Times, South Bay Research, United ICAP and Wall Street Journal.
[1] Wall Street Journal, 10/24/13. IRS Inspector General report stating that between 20 and 25% of EITC payments each year were “improper,” averaging at least $11 billion.